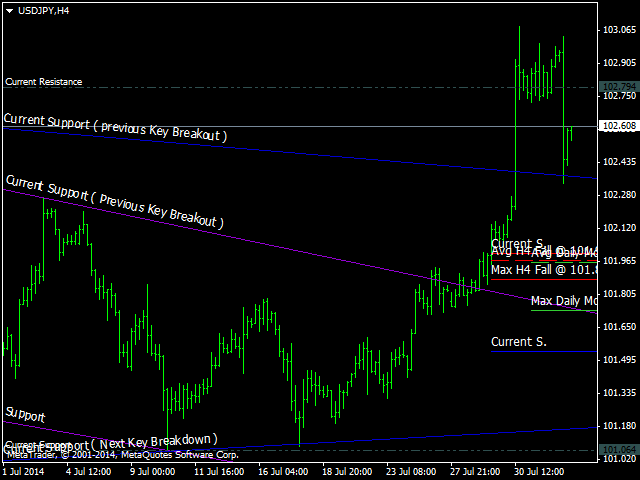
SR Key Breakout and Jump Levels
Key Breakout and Jump / Fall levels. Not late. It is not redrawn.
- The trend line is used to detect the pattern for the model "triangle", support and resistance lines, and how to break the line up or down.
- Trend lines are formed before the pair reached its price. The line is not redrawn.
- In each line there is a description, for example, Support, Current-Support as key breakout down, and Current-Resistance as a key breakout up.
- Each punched line becomes the new level of support or resistance. Changes occur automatically in real time.
- Nearest to the horizontal trendline support / resistance lines are the strongest.
When a person is under pressure, and sometimes even under normal circumstances, you can forget about something trivial, but in fact important. Here, at the outset formed channel showing breakdowns. And when the price is in a period of consolidation, with lateral movement, people often forget about the triangle patterns. Ultimately, the come the breakdown of their surprise.
This indicator automatically draws the channel and pattern, and the breakdown of drawing the upper and lower limits. Scalpers and day traders mmogut use these indicators on H1 and H4 charts. At a higher timeframes indicator can be used for Swing-trading.
Use this indicator to mind, do not give up on a good MM, immediately lock the position when the relevant conditions. Because the market is not so simple. Better define all the signs and all the carefully considered before making trading decisions. Use the channel and signs of a breakdown, as well as the extent to which the price will bounce during high volatility. You no longer need to build the channels themselves, this indicator does everything for you.

Related posts
TR Breakout Patterns Scanner This price action indicator automates detection the breakdown of the trend patterns and patterns re-breakdown testing , and...
Fifth dimension MT4 Indicator searches and marked on the chart trading signals "Fifth Dimension". DETAILED DESCRIPTION graphical models forming trade...
The Levels of Volatility The indicator indicates support / resistance levels based on the volatility of the currency for a selected period (the number of...
Next posts
- VACrocodile
- AnyCandleGroup
- GM Stochastic MIDL

No comments:
Post a Comment