Showing posts with label Technical Indicators for MT5. Show all posts

Tuesday, December 24, 2019

Renko Charts

renko Charts


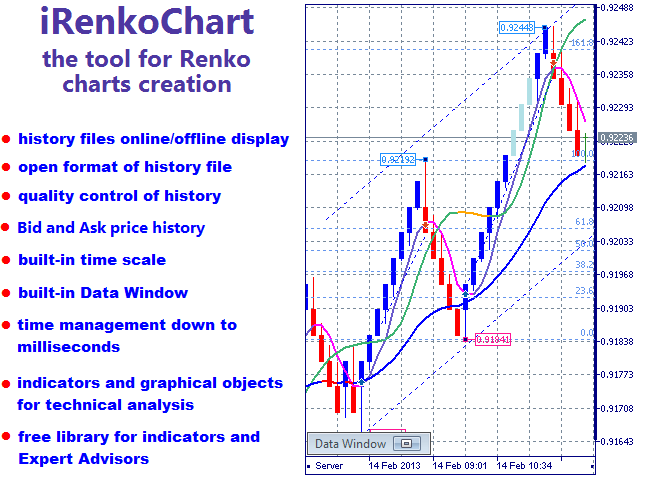
iRenkoChart indicator is designed to create a custom Renko charts. Used open format of history files, easy switching between the graphs based on the Bid and Ask quotes, quality control history, the use of experts, indicators and graphical objects for technical analysis and much more.


This indicator is based on the engine iCustomChart and is its particular implementation. ICustomChart demo version can be downloaded free of charge.
Content:


  1. Advantages and features

  2. Input parameters

  3. indicator buffers

  4. data window

  5. history files

  6. Quality control History

  7. Timeline 

  8. Graphical objects for technical analysis

  9. Indicators and experts


1. Advantages and features


  • starts and runs on any open chart window (hereinafter - the graphic substrate);

  • after downloading looks like a normal chart (see screenshot);

  • to get started is not required to have a pre-generated history files; 

  • used open format of history files;

  • You can use the data format of MetaTrader 4, MetaTrader 5;

  • easy switching between graphs based Bid or Ask quotations;

  • quality control of history (see screenshot 7);

  • full format's history, including the opening of the boxes (bars), spread, tick and stock volumes;

  • has built-in data window (DataWindow) (see Screenshot 4);

  • has built-in time scale (see screenshot 6);

  • automatic scaling of the price scale;

  • can use most of the objects from the standard set MetaTrader 5 (see screenshot 2) for technical analysis;

  • the ability to display online- or offline-graphs;

  • the ability to control the time of opening bars to the millisecond;

  • you can write on the basis of the schedule iRenkoChart own indicators and advisers using free LibCustomChart library (see screenshot 3, 8).


2. Input Parameters


  • Max bars in chart - It allows you to display a fixed number of bars (boxes) in the chart window. A zero value can display the maximum possible number of bars, up to a specified client terminal settings. When this parameter acts as a parameter similar client terminal described in the certificate. The default is 1000.

  • Size of box - range or size (boxes) bars in points from the opening price (the open) to the closing price (close). The default is 200.

  • Value of zero buffer - zero buffer value is calculated in accordance with the selected price constant.


3. Indicator buffers


Number indicator buffer
Content


0It contains selected price constant. Buffer is mainly intended for data other indicators that use the first form of the call.
1bar opening time (boxing).
2The opening price of the bar.
3The maximum price of the bar.
4The minimum price of the bar.
5The closing price of the bar.
6Color bar.
7Exchange volume.
8Tick ​​volume.
9Spread.

4. Data Window


Built-in data window looks similar to regular window in the MetaTrader 5 data, but has a few additions (Screenshot 4). The data fields are displayed in the window:


  • the top field - symbol and a parameter name. The - this bar point size (Size of box), specified in the input parameters of the indicator. When you click on this field to load a window with information about the history of the file (Screenshot 5).

  • Date - bar opening date.

  • Time - the opening of the bar.

  • Open - the opening price of the bar.

  • High - the maximum price of the bar.

  • Low - the minimum price of the bar.

  • Close - the closing price of the bar.

  • Volume - exchange volume.

  • Tick ​​Volume - tick volume.

  • Spread - Spread bars.

  • Bar - bar number; Zero bar - the last unfinished bar.


The data window has several display control buttons Graphics:


  • Shadows - button enables / disables the display of shadows on the keyboard keys duplicated "S";

  • Update - button on / off mode, the update schedule (hotkey "U");

  • Bid / Ask - button switch the display graphics based on the Bid or Ask Price (hot keys "B"And"A"Respectively);

  • Open / Close - open / close data window button in the upper right corner of the data window (hotkey "W");

  • Redraw - redrawing the graphic button is located next to the closing of the data window (hotkey "R").


Keyboard shortcuts only work with the active chart window.


5. History Files (HST-files)


To draw graphs using the open format of history files, described in the User Guide MetaTrader 4. You can get ready for Renko history file or create it yourself. You can then use iRenkoChart display for graphics.


The format of the history file is as follows. First there is the history of the file header:


struct HistoryHeader
{
  int version // version of the database
  char copyright [64]; // copyright
  char symbol [12]; // tool
  int parameter; // period or setting tool for iRenkoChart the value of the input parameter "Size of box"
  int digits; // number of digits after the decimal point in the tool
  time_t timesign; // temporary fingerprint database creation
  time_t last_sync; // the last synchronization
  int type; // type of stored history, 1 - Ask-story, 2 - Bid-story,
                        // any other value - kind of history is not defined
  int unused [12]; // for future use
};

Please note that the new "type" parameter has been added to the standard header.


base version history files MetaTrader 4 indicates "400" for MetaTrader 5 - "500". This is important because each version has its own bar data structure.


Standard representation of an array of bars, following the headline for the story version of "400" is as follows:


#pragma pack (push, 1)
struct RateInfo
{
 time_t ctm; // time in seconds
 double open; // open price of the bar
 double low; // the minimum price of the bar
 double high; // maximum bar price
 double close; // closing price bar
 double vol; // volume
};
#pragma pack (pop)

Standard representation of an array of bars for the history file version of "500" is as follows:


#pragma pack (push, 1)
struct MqlRates
{
datetime time; // bar time in seconds or milliseconds
double open; // open price
double high; // the highest price for the period
double low; // lowest price for the period
double close; // close price
long tick_volume; // tick volume
int spread; // spread
long real_volume; // exchange volume
};
#pragma pack (pop)
Note that the version of "500" bar time can be specified in seconds, and milliseconds. iRenkoChart correctly identifies both of the time format.
Important: The responsibility for the correctness of the history of the file the user.

To iRenkoChart to recognize the history of the file, it must be in the folder "katalog_dannyh_terminala \ MQL5 \ Files \ iRenkoChart \ History \ imya_brokera". File name history


  1. It must begin with the "Renko" prefix. Before prefix may be added "Ask" or "Bid", if the file is stored in the appropriate type of stories;

  2. then the tool should indicate the name of the graph is an indicator substrate is loaded (e.g., "EURUSD");

  3. should go further value of the input parameter "Size of box" indicator;

  4. and must have the extension ".hst".


An example of the file name: AskRenkoEURUSD200.hst


If the history file does not exist, it will automatically be created from the minutes of history available in the terminal. If there is, then it will be updated in accordance with a built-in algorithm.


6. Quality control History


To file stories created exclusively iRenkoChart, possible to control the quality of the story.


Any new history file is created from minute stories available in the terminal. Accordingly, there may be situations where simulated bars may differ from the bars, created online. Each questionable modeled bar graph is displayed in a lighter color than the correct bars (screenshot 7). It allows you to visually assess the quality of the story.


When initializing the indicator or switch Bid and Ask stories in the magazine appears on its quality (Screenshot 7). It is possible to estimate the percentage of good and bad bars. Note that calculation history quality only for bars shown in the chart, not to the entire history of the file.


Also taken into account in the formation of history gaps. In the graph visually default gaps are displayed as bars in gray and zero volume.


Using the indicator buffer "color bar", you can program to assess the quality of the stories of their indicators and experts. This allows you to make appropriate decisions in the implementation of a particular trading strategy.


Improve the quality of stories by iRenkoChart only online. When you receive a tick data iRenkoChart correctly calculates all parameters of bars and stores them in the history file. For example, the opening of the bars will be calculated and written down to the millisecond. If the tick data to construct a history for some time have been reported (remote connection, disable the terminal or any emergency situation), the missing history Renko will be formed based on the minute. 


7. Timeline


The time scale graphs created with iRenkoChart, usually does not coincide with the scale of the graph and the time the substrate is nonlinear. Therefore, in the indicator built own time scale for visualization (screenshot 6). Features built-in scale:


  • It looks similar to the regular time scale;

  • easily it moves vertically;

  • It has a translucent background, always visible graphics and price chart for the scale.


8. Graphical objects for technical analysis


Standard graphics objects terminal attached to the timeline graph substrate when placing in the graph window. Therefore iRenkoChart automatically rebound overlay graphics to your timeline. This makes it possible to use standard graphics for technical analysis Renko charts. Synchronization with iRenkoChart supported for the following full-time graphical objects in the MetaTrader 5:


  • lines: horizontal, vertical, trend, trend of the corner, cyclic, lines with arrows;

  • Channels: equidistant, Andrews pitchfork;

  • Fibonacci tools: line, time zones, fan, arcs, channel expansion;

  • Instruments Elliott: impulse wave corrective wave;

  • shapes: triangle, rectangle, ellipse;

  • arrow: good, bad, down, up, stop, tick, left and right price tag, the icon "Buy" and "Sell", custom arrow.


Sometimes, such as when closing the terminal, iRenkoChart stores data about the objects in a temporary file, which is located in the folder "katalog_dannyh_terminala \ MQL5 \ Files \ iRenkoChart \ Objects". all temporary files are also deleted when you delete iRenkoChart of the chart window.


9. Indicators and experts


Conventional indicators, as well as objects, follow the timeline graph substrate. To bind to the timeline indicator iRenkoChart recommended to use the free LibCustomChart library.


library functions allow you to write indicators that automatically connect to iRenkoChart (Screenshot 3), if it is loaded in the graphics window. If not loaded, these indicators will be no problem to work in a normal chart window. In addition, the library provides simplified access to Timeseries iRenkoChart.


If the library functions used in the expert, the expert, as well as the indicator will automatically use iRenkoChart data if it is already loaded in the graphics window. If iRenkoChart not loaded, the expert will work in the usual chart window and use the data.


Examples of the use of the library in the indicators and experts can be found in Code Base.


This indicator is based on the engine iCustomChart and is its particular implementation. ICustomChart demo version can be downloaded free of charge.
Renko Charts

Related posts


  • Herrick Payoff Index


    Herrick Payoff Index payment index Herrick (Herrick Payoff Index, HPI) confirms the strong trends and helps determine when they change its direction;...


  • Kagi Chart


    kagi Chart Kagi Chart indicator can display graphics "Kagi" in the indicator window. Graphics Type "Kagi" filters out unwanted noise and help identify...


  • Trajecta Smart


    Trajecta Smart Trajecta Smart - an innovative semi-automatic trading signals indicator for each pair and timeframe, which has a built-in system to...

Next posts


Monday, December 9, 2019

Trend Expert

Trend Expert


This indicator is a trend. Its main purpose - as quickly as possible to identify the trend of prices
and as accurately as possible to follow it until it ends. current direction
prices characterized by color indicator. The basis of the indicators laid theory
Dow Jones
, according to which the prices in the financial markets move directionally,
and the upward trend is characterized by the excess of each subsequent
minimum / maximum of the previous minimum / maximum, and descending - down
each subsequent high / low in relation to the previous
maximum / minimum.


Thus, the main advantages for the trader are:


  • lack of
    any external parameters
    . The user does not need to delve into the specifics
    indicator. After a huge amount of optimization and testing processes
    We were picked up by the most appropriate indicator parameters for finding extrema
    and created three modes: scalping,
    medium-term trend and long-term
    trend.


    • scalping mode (short-term trend) must
      used by traders, trading on the M1-M5, and putting
      stop orders profit / loss of not more than 20 points (4 digits). This mode
      certain situations also pinpoints and medium-term (intraday)
      trend (>100 points). Recommendation for a short take profit only
      It suggests that in this case, the majority of transactions (>90%), a statistically
      will be profitable.

    • medium-term trend mode (intraday trend) must
      used by traders, trading on the M5-M15, and putting
      target profit / loss of 20 to 50 points (4 digits).

    • long-term trend mode must
      used to confirm trends in the H1-D1. In this
      Mode profit target >100 points (4 digits).


  • calculation function
    Extrema takes into account the volatility
    Tool that provides the most accurate determination of the trend at
    high volatility.

  • The indicator does not clutter the graph. current
    the trend is characterized by the color chart candles, respectively,
    a trader can use an additional set of other indicators.

  • The indicator is not redrawn even on the zero bar.
    If the indicator changed color (changed trend direction), then the next shift
    the trend is only possible if the stop loss is triggered. A stop order
    calculated according to a specific algorithm that takes into account the current volatility.

  • Automatically built equidistant channel, which shows the current direction of trends and best approximates
    the current trend. The channel is always directed only in the direction of the trend, and can be used to determine points
    opening / closing position.

  • For the purposes of risk management, the chart always shows
    stop loss line
    . The indicator always shows a definite
    signal (BUY or SELL), trend change is possible only when the level stop loss.

  • The indicator has a very flexible settings visualization.


This indicator is the result of more than five years' programming experience and practical trading on the currency market. The idea forming the basis of this indicator, in practice it has proved its effectiveness and efficiency.


Trend Expert

Related posts


  • TSO Currency Trend Aggregator MT5


    TSO Currency Trend Aggregator MT5 Indicator TSO Currency Trend Aggregator job compares the behavior of currency pairs 7. It allows you to instantly...


  • FxGlow Force Factor MT5


    FxGlow Force Factor MT5 This unique indicator determines the trend of using a complex system of filters. Applied calculation method that follows the...


  • EasyTrading Reversal Expert


    EasyTrading Reversal Expert AlwaysWin Expert represents fully automated trading robot , which opens / closes the market position on your behalf and...


Next posts


Thursday, November 14, 2019

Gekko MACD Plus

Gekko MACD Plus


A type: oscillator


Indicator of convergence / divergence moving averages Gekko (MACD) - a modified version of the famous indicator MACD. The indicator combines the standard MACD indicator with different calculations input signals and notification of a potential entry point.


Input parameters


  • Fast MA Period - period of the fast moving average MACD indicator (default 12);

  • Slow MA Period - - period of slow moving average of the MACD indicator (26 by default);

  • Signal Average Offset Period - MACD signal averaging period;

  • Method for calculating input signal (swing):


    • 1 - generates signals to the input / output swing trading based on the intersection of fast and slow moving line;

    • 2 - generates signals to the input / output swing trading based on trend shift in the histogram (delta fast and slow moving);

    • 3 - generates signals to the input / output swing trading based on the average signal and MACD intersection;


  • Histogram Trend Bars To Confirm - if the selected method of calculation of "2", this parameter specifies the number of bars needed to confirm a trend change;

  • Applied Price - the price used for calculation: high, low, opening price, closing, and others.

  • Show Moving Averages On Main Chart - at a value of true line of fast and slow moving are shown on the graph;

  • Write Logs On Terminal Window - if true, the indicator will add entries to swing signals to the experts log;

  • Send Mobile Push Notifications - if true, will be sent to push-notification signals to your smartphone;

  • Send E-Mail Alerts - if true, you will be notified by e-mail, it is necessary to configure the terminal.


Good luck trading!


Gekko MACD Plus

Related posts


  • TSO Currency Trend Aggregator MT5


    TSO Currency Trend Aggregator MT5 Indicator TSO Currency Trend Aggregator job compares the behavior of currency pairs 7. It allows you to instantly...


  • Extended Keltner Channel MT5


    Extended Keltner Channel MT5 Extended version of the Keltner Channel. You can use a variety of moving average 21 and 11 different prices to calculate the...


  • OnBalanceVolumeSurrogate MT5


    OnBalanceVolumeSurrogate MT5 A special version of the indicator On-Balance Volume (OBV), built in the pseudo-real volumes emulated from tick volume....


Next posts


Thursday, October 17, 2019

FxGlow Force Factor MT5

FxGlow Force Factor MT5


This unique indicator determines the trend of using a complex system of filters. Applied calculation method that follows the trend.


It is also equipped with advanced statistics signals, on which the trade target.


Expected results


To achieve more accurate results, use this tool as a supplement to your trading system. It works best in combination with the right strategy.


Combination


Trade reversals in the direction of the trend by combination with FxGlow Reversal Edge.


Check out the strategy for the video by clicking on the link: https://youtu.be/Rh07nTKhALE


Trade breakthroughs range, following the trend and increasing revenue opportunities by combining the indicator with FxGlow Tight Congestion.


Check out the strategy for the video by clicking on the link: https://youtu.be/lAOYs1RqsWU


Key Features


  • Recognizes and works with the trend

  • A unique way of calculating statistics


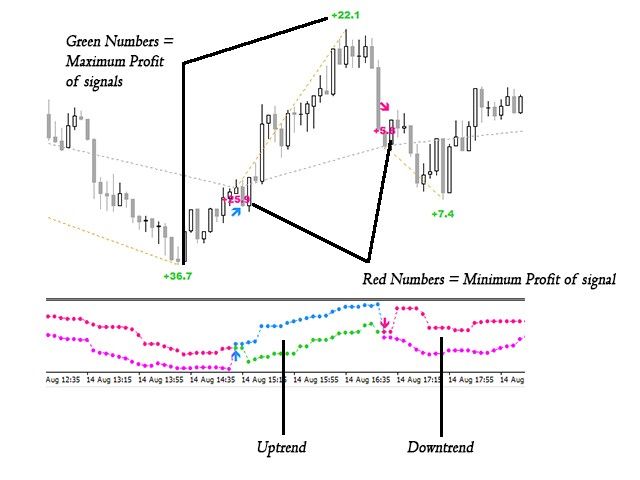
    • It calculates the minimum gain of the signal, known as the absolute profit / loss


      • The minimum profit from the purchase - from a buy signal before the new sell signal

      • The minimum profit from the sale - from sales to signal a new buy signal


    • Calculates the maximum profit from the signal


      • Maximum profit on the purchase - the signal to the maximum point

      • Maximum profit on the sale - of the signal to its lowest point


  • It can calculate the target profit, based on statistics


    • The average minimum value - minimum possible result of the next transaction

    • Mean maximum value - the maximum possible result of the next transaction

    • For more information on target earnings look video: https://youtu.be/PdeJaWqe9Rg?t=1m28s


  • Perfect for use as a trend filter to existing strategies


    • Trade with the trend always gives a better chance of making a profit


  • is not redrawn

  • NOT recalculated

  • The signals at the close of the bar

  • It works on all cylinders

  • It works on all timeframes

  • It can be used with advisers

  • It has the functions of a pop-up notification, the notification e-mail, push-notification and sound alerts


settings


  • Period - the number of bars used to calculate

  • Max Bars - the maximum number of bars used historic


Using


Use as a trend filter


  • In this case, the indicator combined with other trade indicators

  • The green line indicates the upward trend and the need to conclude transactions for the purchase only

  • The red line indicates a downward trend and the need to conclude deals only for sale


The use to enter the market


  • For best results, you need to check whether a trend repeated on a larger timeframe signal on younger timeframe

  • = Buy signal can be bought.


    • Example: uptrend H4. On H1 we take only buy signals


  • = Sell signal can be sold.


    • Example: The downtrend on the M30. On the M15, we only accept signals for sale


profit goal


  • The minimum average


    • It can be used as a minimum take profit

    • It can be used as take profit when scalping

    • It can be used as an area for taking part of the profit, and the remaining profit will be used in trade


  • The maximum average


    • It can be used as the maximum take-profit

    • It can be used as an exit point for all positions


notes


The indicator is designed for a variety of manual trading methods.


First try the free demo version to test its effectiveness in combination with your trading systems.


FxGlow Force Factor MT5

Video


Related posts


  • FxGlow Zone Barrier MT5


    FxGlow Zone Barrier MT5 This unique indicator identifies overbought and oversold using adaptive support and resistance levels calculated based on the...


  • Trajecta Smart


    Trajecta Smart Trajecta Smart - an innovative semi-automatic trading signals indicator for each pair and timeframe, which has a built-in system to...


  • TradeLeader Indicator


    TradeLeader Indicator Signal indicator, based on the volatility of the asset. It tracks the volume levels of volatility and market movements with the...


Next posts


  • Gekko MACD Plus

  • Trend Expert

  • Renko Charts

Friday, September 27, 2019

Average True Ticks MT5

Average True Ticks MT5


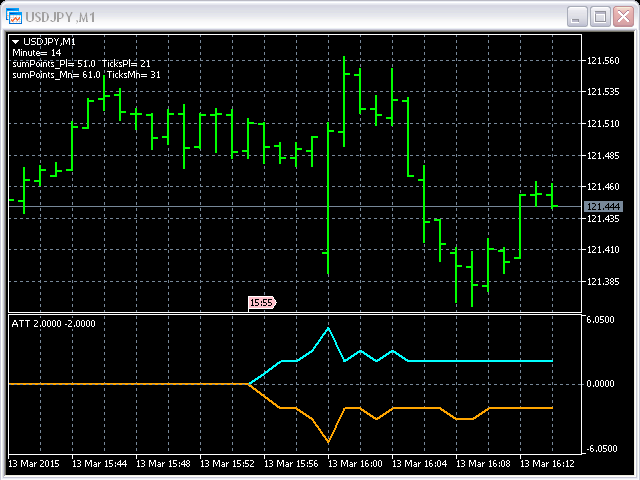
This indicator works on M1 timeframe and displays 2 lines:


  • The amount of points, that the price went up, divided into The amount of ticks, that the price went up (turquoise).

  • The amount of points, that the price went down, divided into The amount of ticks, that the price went down (orange).


All basic data is displayed in the upper left corner of the chart in the form of a comment.


Keep in mind that the amount of points is greater than or equal to the sum of ticks.


Of course, ATT indicator calculates all ticks only in the forward direction, starting from the date of placement of the indicator on the chart.


Average True Ticks MT5

Related posts


  • Average Spread


    Average Spread It is a tool for those who want to know exactly what is happening with your broker. It not only shows the average spread in real time...


  • Adaptive Moving Average MT5


    Adaptive Moving Average MT5 The adaptive moving average Kaufman (AMA) with switchable channel indentation in points and signals on the intersection. The...


  • Moving Average Price Level


    Moving Average Price Level Moving Average displaying price tags. settings Period MA - MA period; Shift MA - displacement of MA; Method MA - smoothing...


Next posts


  • FxGlow Force Factor MT5

  • Gekko MACD Plus

  • Trend Expert

Wednesday, August 28, 2019

Adaptive Moving Average MT5

Adaptive Moving Average MT5


The adaptive moving average Kaufman (AMA) with switchable channel indentation in points and signals on the intersection.


The standard indicators MetaTrader 5 no possibility filtration, besides added 8 calculation mode as low (Open + Close) / 2, except 7 standard. Added selection moving average smoothing method used in calculating the efficiency rating (ER). Filtering trend in the choice of paragraphs or "deviation". Added displaceable indicator left / right. You can also choose the arrow symbol direction and level crossing.


Version for MT4 https://www.mql5.com/ru/market/product/2681


Options:


  • PeriodAMA - calculating the total period;

  • PriceType - used price;

  • Fastest - rapid period;

  • Slowest - slow period;

  • dSMT - coefficient;

  • dAMA - coefficient;

  • PointsTrendDetection - determining the direction change mode;

  • Displace - shift left / right;

  • DistancePointsFromAMA - distance from the straight channel;

  • CheckOpenOtherSide - check the opening on the other side of the canal;

  • CalcDistanceOnClosedBar - calculation of the distance along the closed bars;

  • AlertTextEnabled - inclusion of the alert text;

  • AlertSoundEnabled - inclusion of the alert sound;

  • PushMessageEnable - inclusion of notification;

  • AlertSoundFile - the name of the sound file for the alert;

  • ShowUpDnPoints (true) or UpDnDistance (false) - selection of display modes: the growth / drop or channel;

  • HideUpDnPoints - disable mapping rising / falling;

  • HideCrossPoints - disabling the channel display intersection points;

  • iArrowUp - Growth character code;

  • iArrowDn - code fall symbol;

  • iArrowCross - the intersection of the character code with the channel;

  • Method - ER smoothing method.


Adaptive Moving Average MT5

Related posts


  • Moving Average Price Level


    Moving Average Price Level Moving Average displaying price tags. settings Period MA - MA period; Shift MA - displacement of MA; Method MA - smoothing...


  • Average Spread


    Average Spread It is a tool for those who want to know exactly what is happening with your broker. It not only shows the average spread in real time...


  • Bulls and Bears indicator


    Bulls and Bears indicator Bulls and Bears Indicator An indicator showing who is dominant at the moment on the market : buyers (Bulls-bulls) or sellers...


Next posts


  • Average True Ticks MT5

  • FxGlow Force Factor MT5

  • Gekko MACD Plus

Wednesday, August 7, 2019

MTF ZigZag MT5

MTF ZigZag MT5


Indicator Zig-Zag - a very useful tool to determine the trend,
support and resistance, and to recognize classical
graphical models, such as "head and shoulders", "double bottom" and
"Double top".


This multi-taymfreymovy indicator.


The indicator automatically calculate the following 3 available timeframe and draws a zigzag ?? based on those timeframes.


The indicator can not be used on older day timeframe (D1).

To work product Indicators / Examples directory you should be ZigZag indicator.


MTF ZigZag MT5

Related posts


  • Kolier SuperTrend MTF


    Kolier SuperTrend MTF This version of the original multiple timeframe indicator Kolier SuperTrend. In this version to determine the trend , you can use...


  • Ichimoku MTF


    Ichimoku MTF MTF Ichimoku - an indicator for MetaTrader , based on the well known Ichimoku. Ichimoku is included in the standard set of technical...


  • Katong Zigzag


    Katong Zigzag This indicator is a modification of the original zigzag. I usually use the indicator on the GBPUSD with timeframe H4. This indicator works...


Next posts


  • Adaptive Moving Average MT5

  • Average True Ticks MT5

  • FxGlow Force Factor MT5

Thursday, July 25, 2019

Kolier SuperTrend MTF

Kolier SuperTrend MTF


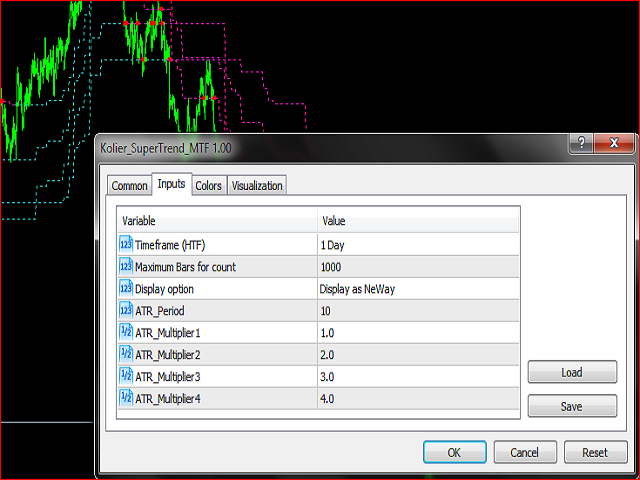
This version of the original multiple timeframe indicator Kolier SuperTrend.


In this version to determine the trend, you can use four lines supertrenda that will provide more reliable results.


It changed the calculation of signal in small time frames. When used on smaller timeframes indicator is not redrawn.


Kolier SuperTrend MTF

Related posts


  • Ichimoku MTF


    Ichimoku MTF MTF Ichimoku - an indicator for MetaTrader , based on the well known Ichimoku. Ichimoku is included in the standard set of technical...


  • Multi TimeFrame PSAR


    Multi TimeFrame PSAR This indicator is based on the popular indicator Parabolic SAR. Indicator Parabolic SAR is plotted as points located above or below...


  • Angle Regression Line with Diverg


    Angle Regression Line with Divergence The indicator can accurately determine the strength and direction of the trend . The histogram in a separate window...


Next posts


  • MTF ZigZag MT5

  • Adaptive Moving Average MT5

  • Average True Ticks MT5

Thursday, July 11, 2019

CCI normalized

CCI normalized


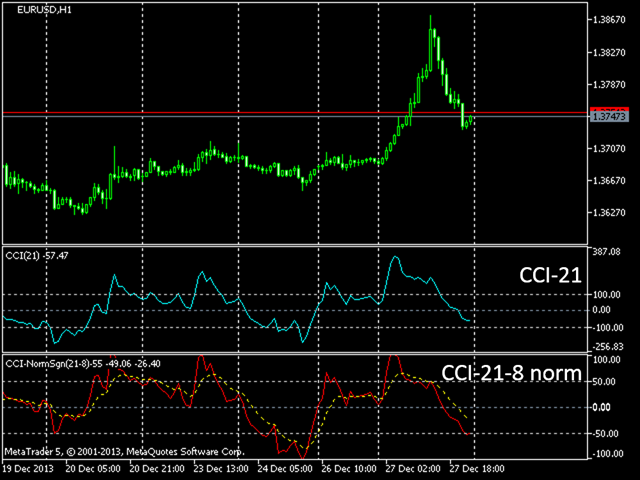
Technical Indicator Commodity Channel Index (Commodity Channel Index, CCI) measures the deviation of the commodity price from its average statistical price. High values ​​of the index indicate that the price is unusually high compared to average and low - that is too low. Despite the name, Commodity Channel Index is applicable to any financial instrument not only to goods.


There are two main ways of using Commodity Channel Index:


  1. To find differences.

    The divergence appears when the price reaches a new maximum, and Commodity Channel Index can not grow above the previous maximums. This classical divergence is normally followed by the price correction.

  2. As an indicator perekuplennosti / resale.

    Commodity Channel Index usually varies in the range of ± 100. Values ​​above 100 indicate an overbought condition (and a probability of correcting decay), while values ​​below 100 - about the overselling state (and the probability of correcting increase).


Calculation


D = Price - SMA (TP, N)

SMA (D, N) = SUM (D, N) / N Simple Moving Average

M = SMA (D, N) * 0,015

CCI = M / D


CCI does not refer to indicators operating with fixed values, which complicates comparison of different markets and time periods.


To solve this problem, the values ​​are normalized within the next interval.


CCInorm = (CCIreal-CCImin) * (relMax-relMin) / (CCImax-CCImin) + relMin


Common parameters:


  • Symbol - set a different graphic symbol, for example, to study the correlation.

  • CCI period - the number of bars for the calculation of the CCI.

  • Normalization period - the period of time during which we calculate the values ​​of normalization.

  • Period smoothing - the period for calculating the signal line (EMA).

  • TimeFrame - allows you to see the ATR according to another timeframe.

  • Maximum level - the highest level of normalized CCI (default - 100).


Benefits


  • It shows the level of volatility in the relative form: more than yesterday, less than a month ago, etc.

  • It simplifies the comparison of volatility of different currency pairs.

  • Visually displays the level of correlation between the different pairs.


CCI normalized

Related posts


  • All MT5 TimeFrames CCI


    All MT5 TimeFrames CCI This indicator is based on a classic display CCI (Commodity Channel Index, Commodity Channel Index) . It will be useful for those...


  • TSO Currency Trend Aggregator MT5


    TSO Currency Trend Aggregator MT5 Indicator TSO Currency Trend Aggregator job compares the behavior of currency pairs 7. It allows you to instantly...


  • Bulls and Bears indicator


    Bulls and Bears indicator Bulls and Bears Indicator An indicator showing who is dominant at the moment on the market : buyers (Bulls-bulls) or sellers...


Next posts


  • Kolier SuperTrend MTF

  • MTF ZigZag MT5

  • Adaptive Moving Average MT5

Thursday, June 20, 2019

Pan prizMA

Pan prizMA


The indicator plots the moving line based on a polynomial interpolation of 1-4 degrees and / or function, made up of the sum of sine waves 1-5. Combinations are possible, for example, the sum of three sinusoids about parabola of second degree. Built a line can be extrapolated any of the functions and different distance in the form of a single point on each step of the indicator (not changeable line), as well as a portion of a given function (redrawn) to visualize the construction.


Details: https://www.mql5.com/ru/market/product/18363#!tab=comments


The display four lines involved. Each of the next line of the indicator is based on the results of the previous one. Each line except the first can be either an averaging or extrapolating depending on said direction.


The principle of linear interpolation


It is known that the minimum you need two points to draw a straight line, three points to hold a square parabola, four - cube, etc. Direct - is an arithmetic progression in order to obtain the third point after the first two: Y3 = (Y1-Y2) + 2 * Y2 = Y2 - Y1 - differential equation of the first degree to equidistant points (similar to equation after canceling all Lagrange equation coefficients).


The principle of the trigonometric interpolation


Using the sine of the double angle formula: Sin 2a = 2 * Cos a * Sin a. Geometrically can prove its validity as Sin 2a = 2 * Cos a * Sin a - 0, and accordingly Sin 3a = 2 * Cos a * Sin 2a - Sin a and so on, where Cos a - cosine of the angle of one step, and Sin, in fact, the corresponding value of the schedule. Then the differential equation of the first degree to near zero sine wave looks like: V3 = 2 * Cos a * U2 - U1. We see a complete analogy with the equation for a straight line. The transition from the display trigonometric equations to linear ensured assignment period equal to one. Cos 360 is 1, then degenerates into a linear equation.


External variables (for example, the first two lines)


  • line_1_power = 12 - the degree of the interpolation line. For trigonometric function of degree 2 corresponds to a sinusoid about constant. Grade 3 corresponds to a sinusoid about the inclined straight line. Degree 4 corresponds to a sinusoid or a square parabola around or about two sinusoids constants and so on. In this case with six 12 degree periods designated below corresponds to the function of the folded about 6 sinusoids constants.

  • line_1_leverage = 10 - interpolation shoulder. Analog averaging period. In particular, a first degree interpolation line fully corresponds to the classical EMA with a period twice.

  • line_1_interval = 1 - spacing between neighboring points involved in the calculation. Not to be confused with the shoulder. In particular, direct connects three points, two of them are adjacent and removed one at shoulder distance.

  • line_1_period_1 = 6 - period of a sine wave, if the trigonometric function. If the linear function is set to 1.

  • line_1_period_2 = 7.5

  • line_1_period_3 = 10

  • line_1_period_4 = 20

  • line_1_period_5 = ​​60

  • line_1_period_6 = 240

  • line_1_shift = 0 - shift indicator line. By default, lines are drawn based on the indentation on his shoulder.

  • XXXXXXXXXXXXXXXXXXXXXXXX1 = 2 - separator parameters different lines for clarity.

  • line_2_trend = 1 - calculating the direction of the line (-1) - averaging (1) - extrapolation.

  • line_2_power = 10 - the degree of the interpolation line. If other parameters - the same as averaging, the second line will pass through the point of opening last bar. Degrees 1001, 1002, 1003-1009, 1010 extrapolated function portion. This portion functions redrawn on each bar and serves only for visualization.

  • line_2_leverage = 8 - shoulder interpolation, each value of the indicator on the draws one point the remote at this arm, and is not redrawn, even to the extent of the bar, because it is based on the point of opening. In the case of degrees 1001, 1002, 1003-1009, 1010 specifies the length portion being drawn functions.


It may be a combination of external parameters that are gone away from the line of the current price. The easiest way to discover the beginning of the schedule and see the character line. For example, the interpolation polynomial of degree greater than four in the indicator is mathematically possible, but fluctuations in the average line to quickly grow in amplitude, reminding resonance.


Video


Related posts


  • DeltaID5 R002 DeltaVolume


    DeltaID5 R002 DeltaVolume Indicator inspired by the famous graphic MarketDelta. The indicator calculates the difference between the transactions...


  • Elder AutoEnvelope


    Elder AutoEnvelope Envelopes (Envelopes) or channel lines are similar to moving averages (or slow MA with two MA). Inside the channel lines daily...


  • Bulls and Bears indicator


    Bulls and Bears indicator Bulls and Bears Indicator An indicator showing who is dominant at the moment on the market : buyers (Bulls-bulls) or sellers...


Next posts


  • CCI normalized

  • Kolier SuperTrend MTF

  • MTF ZigZag MT5

Tuesday, May 14, 2019

PZ Timeframe Overlay MT5

PZ Timeframe Overlay MT5


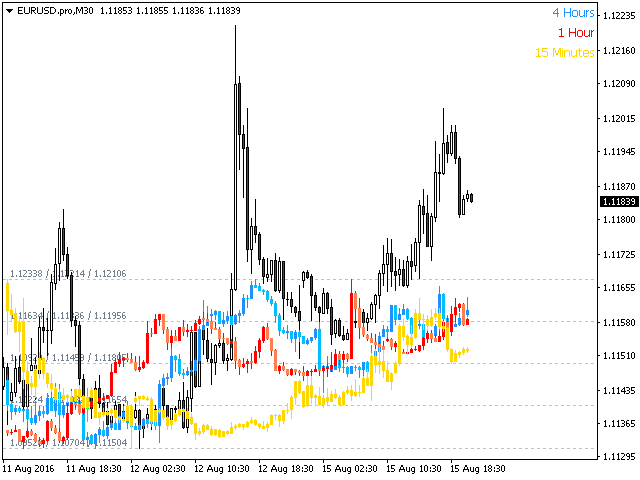
Indicator timeframe Overlay It displays the price action on multiple timeframes on the same schedule, allowing you to quickly evaluate different timeframes from one schedule.


  • No longer need to switch between timeframes!

  • Up to four different time frames can be displayed on the same graph

  • Adjusted according to the size of the graph, the scale and timeframe

  • Adjustable size chart

  • Automatic calculation of the price level

  • Adjustable density price levels

  • Customizable color and size


Input parameters


  • Overlay Settings - selection of time frames to be displayed on the same graph. You must specify at least one time frame, which will be imposed on the current schedule. If the period is set to "none", it will not be displayed.

  • Chart Settings - setting the size chart superimposed with prices on the schedule in the background, as well as placing price tags.

  • Visual Settings - setting the color of text labels and price lines, style and price line number displayed price lines.


Author


Arturo Lopez Perez, a private investor, speculator, programmer and founder of Point Zero Trading Solutions.


PZ Timeframe Overlay MT5

Related posts


  • Multi TimeFrame PSAR


    Multi TimeFrame PSAR This indicator is based on the popular indicator Parabolic SAR. Indicator Parabolic SAR is plotted as points located above or below...


  • Blahtech Daily Range MT5


    Blahtech Daily Range MT5 Indicator Blahtech Daily Range displays the average daily range with ranges of individual sessions. Using the daily opening...


  • Silver Clouds MT5


    Silver Clouds MT5 Cloud indicator draws on a cloud chart. If the current price for the cloud, you should not perform any action. If the current price...


Next posts


  • Pan prizMA

  • CCI normalized

  • Kolier SuperTrend MTF

Monday, May 6, 2019

JuiceEXT

JuiceEXT


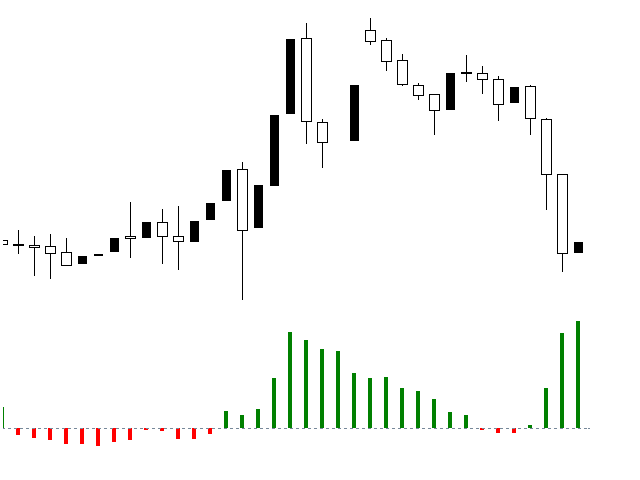
Juice indicator is constructed as a bar graph and is located at the bottom of the indicator window.


Juice indicator reacts to replace the current volatility in the market. When the volatility decreases to minimum values, the histogram crosses the zero level of the indicator, and the value becomes negative. Therefore Juice indicator is designed to filter out the flat.


Do not open position when the red histogram. If all indicators give signals to the input, the final check is carried out on this indicator. The histogram should be green.


It is possible to adjust the period and the level of the indicator sensitivity.


JuiceEXT

Related posts


  • TradeLeader Indicator


    TradeLeader Indicator Signal indicator, based on the volatility of the asset. It tracks the volume levels of volatility and market movements with the...


  • Herrick Payoff Index


    Herrick Payoff Index payment index Herrick (Herrick Payoff Index, HPI) confirms the strong trends and helps determine when they change its direction;...


  • DV2


    DV2 DV2 indicator - an alternative to the RSI (2), designed based DVO. In fact, this is one particular configuration DVO, which was originally developed...


Next posts


  • PZ Timeframe Overlay MT5

  • Pan prizMA

  • CCI normalized

Tuesday, April 9, 2019

FORTS Total Orders

FORTS Total Orders


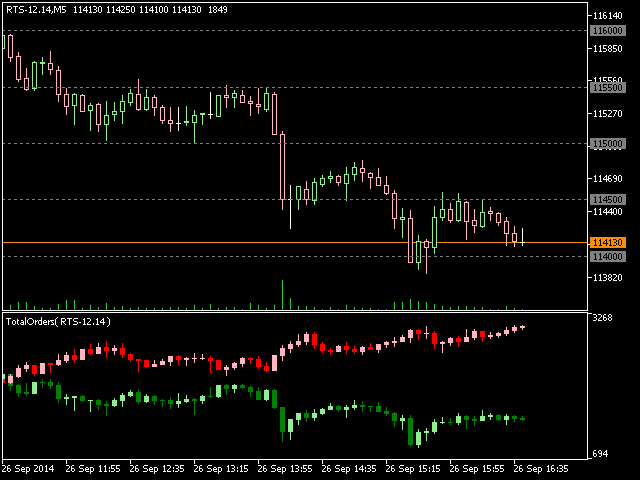
I bring to your attention the indicator showing the ratio of the number of orders of buyers / sellers for the Russian market FORTS futures. Now you can get this information in real time in the terminal MetaTrader 5. This will allow for development of new trading strategies or improve existing.


Data on the ratio of the number of orders are read from the database (CSV text or binary - user selectable). Thus, at the completion of shopping session and turn off the terminal (or the computer), and data is stored at the new start of the terminal - are loaded on a graph.


To maintain database on the ratio of orders you can use the utility FORTS All Saver or any other, save the data in the same format.


The ratio of the number of orders is displayed as two candlestick charts (buyers and sellers). The minimum possible timeframe - M1 (one minute). Thus, we can see a change in the ratio of orders inside the bar and its dynamics in comparison with the neighboring bars.


settings


  • Use CSV-file: Yes - the story is taken from a text file CSV-format; No - the story is taken from the binary file. Naturally, the file must exist in the terminal directory.


  • Use Common Directory: Yes - to use a common directory for all terminals to access the database history; No - each installed system MT5 terminal uses its own directory: "MQL5 \ Files \ TotalOrders".


  • File Name Prefix - prefix to form the file name. The file name is formed from the prefix sign of BUY / SELL, instrument name and extension. For example: "TotalOrdersBUY-GAZR-6.14.CSV". If the empty string is specified as the prefix, the prefix defaults to "TotalOrders".


  • History Show Period - the period of history that is displayed on the graph. It can be set from one day (trading day) of up to one year. It does not depend on the timeframe chart. Of course, the story needs to be physically present in the respective user's computer directory.


  • Chart Color Schema - color scheme indicator. Can be selected from the list - dark colors, light colors, alternate light colors, white on a black background and black on a white background.


  • Show Values ​​on Chart - whether or not the current values ​​Open / High / Low / Close in the indicator window in the form of numbers.


Proposal for interested users:


If you have ideas for improving this product or any of the other offered me, then write about them. In the case of realization of the idea, its author will receive a substantial discount on any of the products offered me.


Please write all the suggestions in the section "Discussion" section of this page - this will document the superiority and the idea of ​​authorship.


FORTS Total Orders

Related posts


  • DeltaID5 R002 DeltaVolume


    DeltaID5 R002 DeltaVolume Indicator inspired by the famous graphic MarketDelta. The indicator calculates the difference between the transactions...


  • Dynamic RSI Pointer MT5


    Dynamic RSI Pointer MT5 Dynamic RSI Pointer designed Pointer Productions Pledge of effective work in the market - this is the best combination of...


  • Trajecta SpeedMap NZD


    Trajecta SpeedMap NZD What happens when you combine a trade market experience and intuition with the algorithm implemented in the form of visual maps? In...


Next posts


  • JuiceEXT

  • PZ Timeframe Overlay MT5

  • Pan prizMA

Tuesday, March 19, 2019

DV2

DV2


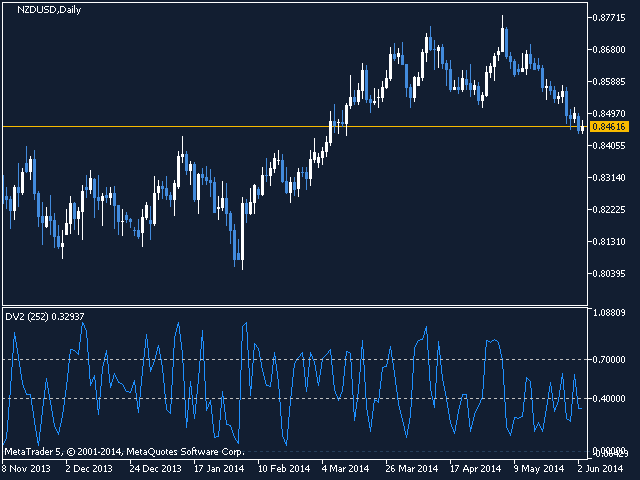
DV2 indicator - an alternative to the RSI (2), designed based DVO. In fact, this is one particular configuration DVO, which was originally developed for SPY. It was found in this case the values ​​of the opening and closing small, and the optimum period was weighing about 50/50 for the last two days. As it turned out, this weighting scheme worked very well and almost all traded funds on the market and most of the shares.


This version involves the use of evaluation of interest function. 


interpretation of values


DV2 indicator is best suited for short-term trading with a return to the average (mean reversion, MR). Appropriate levels perekuplennosti pereprodannosti and vary depending on the instrument. For example: to buy the next day after the opening, when the DV2 is less than 20% and sell the next day after the opening, when the DVO above 80%.


DV2

Related posts


  • Bulls and Bears indicator


    Bulls and Bears indicator Bulls and Bears Indicator An indicator showing who is dominant at the moment on the market : buyers (Bulls-bulls) or sellers...


  • TradeLeader Indicator


    TradeLeader Indicator Signal indicator, based on the volatility of the asset. It tracks the volume levels of volatility and market movements with the...


  • Dynamic RSI Pointer MT5


    Dynamic RSI Pointer MT5 Dynamic RSI Pointer designed Pointer Productions Pledge of effective work in the market - this is the best combination of...


Next posts


  • FORTS Total Orders

  • JuiceEXT

  • PZ Timeframe Overlay MT5

Wednesday, February 20, 2019

Silver Clouds MT5

Silver Clouds MT5


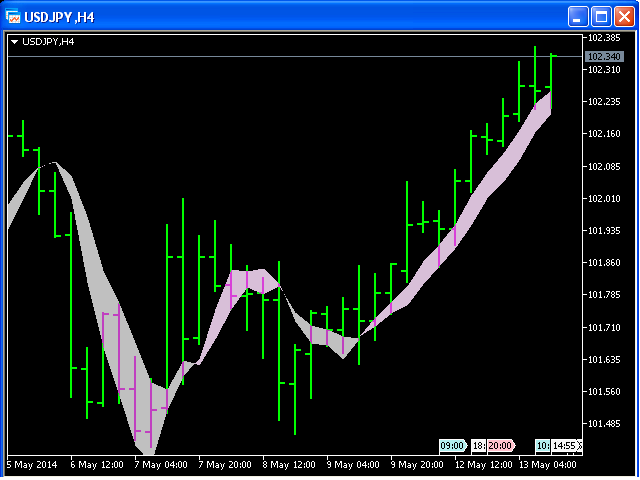
Cloud indicator draws on a cloud chart.


If the current price for the cloud, you should not perform any action.


If the current price moves away from the cloud, it is necessary to consider the possibility of opening a long or short position in accordance with the movement of prices.


Input parameters: Period1 and Method1 is used to adjust the display for each timeframe and currency pair.


Silver Clouds MT5

Related posts


  • All MT5 TimeFrames CCI


    All MT5 TimeFrames CCI This indicator is based on a classic display CCI (Commodity Channel Index, Commodity Channel Index) . It will be useful for those...


  • TSO Currency Trend Aggregator MT5


    TSO Currency Trend Aggregator MT5 Indicator TSO Currency Trend Aggregator job compares the behavior of currency pairs 7. It allows you to instantly...


  • All Harmonics 26


    All Harmonics 26 Harmonic patterns - a characteristic movement of the price in accordance with the Fibonacci levels that are statistically precede a...


Next posts


  • DV2

  • FORTS Total Orders

  • JuiceEXT

Thursday, January 24, 2019

MTF Money Flow Index

MTF Money Flow Index


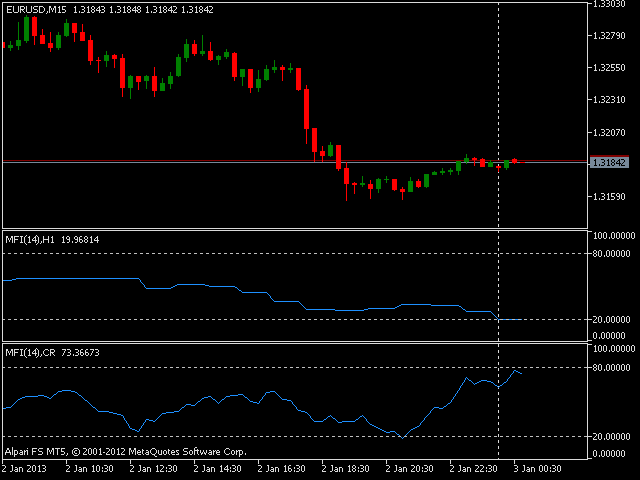
Multitaymfremovaya standard version indicator Money Flow Index (MFI).


Input parameters:


  • TimeFrame - used timeframe:
    It can take any of ENUM_TIMEFRAMES enumeration values.


  • TimeCorrection - use time correction:
    May have a value of true or false (first look at the screen shot: the first indicator is set to true, the second - false.


  • Period - the period for calculating the index:
    May have a value greater than 0. If the value is less than 1, the period 14 is used.


You can simultaneously use multiple copies of the indicator on the same graph.


Version MTF (multiple timeframe) is very useful for developers. Made with the help of their own optimized MTF converter.


When testing the strategy tester, use the Every tick mode.


MTF Money Flow Index

Related posts


  • Herrick Payoff Index


    Herrick Payoff Index payment index Herrick (Herrick Payoff Index, HPI) confirms the strong trends and helps determine when they change its direction;...


  • Ichimoku MTF


    Ichimoku MTF MTF Ichimoku - an indicator for MetaTrader , based on the well known Ichimoku. Ichimoku is included in the standard set of technical...


  • TSO Currency Trend Aggregator MT5


    TSO Currency Trend Aggregator MT5 Indicator TSO Currency Trend Aggregator job compares the behavior of currency pairs 7. It allows you to instantly...


Next posts


  • Silver Clouds MT5

  • DV2

  • FORTS Total Orders

Thursday, January 17, 2019

Four Bands

Four Bands


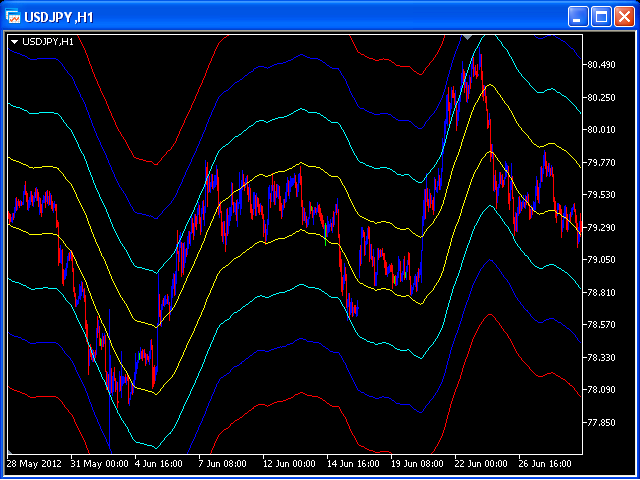
An optimistic trader can enter the market when the price crosses the blue-green line.

A more reliable signal is the intersection cost blue line.

If price reverses and its intersection with the red line, you can open a position in the direction of price movement.


Four Bands

Related posts


  • DeltaID5 R002 DeltaVolume


    DeltaID5 R002 DeltaVolume Indicator inspired by the famous graphic MarketDelta. The indicator calculates the difference between the transactions...


  • ChannelTrend MT5


    ChannelTrend MT5 Indicator ChannelTrend - is a trading system that allows you to analyze the market in terms of several aspects of technical analysis....


  • VolatilityDepth5X


    VolatilityDepth5X VolatilityDepth5X - multi-indicator generating signals based on the detection the most significant volatility Forex market . Upon...


Next posts


  • MTF Money Flow Index

  • Silver Clouds MT5

  • DV2

Tuesday, December 18, 2018

VIP Dynamic Support Resistance

VIP Dynamic Support Resistance


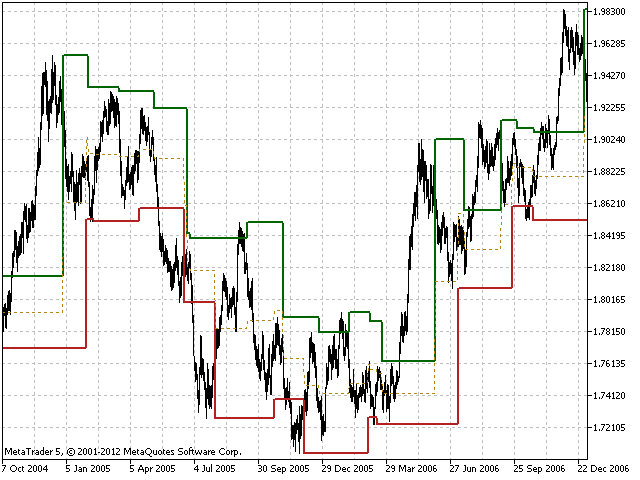
Indicator Dynamic Support / Resistance for MetaTrader. Automatically adjusts for any timeframe.

Used to trade in the channel and channel penetration. Used in the automated trading system, VIP Synergy 3.0.


VIP Dynamic Support Resistance

Related posts


  • Dynamic RSI Pointer MT5


    Dynamic RSI Pointer MT5 Dynamic RSI Pointer designed Pointer Productions Pledge of effective work in the market - this is the best combination of...


  • New Trade MT5


    New Trade MT5 This is a simple, easy-to-use and effective indicator . This strategy is suitable for all traders, even for beginners. Input parameters are...


  • TradeLeader Indicator


    TradeLeader Indicator Signal indicator, based on the volatility of the asset. It tracks the volume levels of volatility and market movements with the...


Next posts


  • Four Bands

  • MTF Money Flow Index

  • Silver Clouds MT5

Monday, November 26, 2018

S2 Price Frequency

S2 Price Frequency


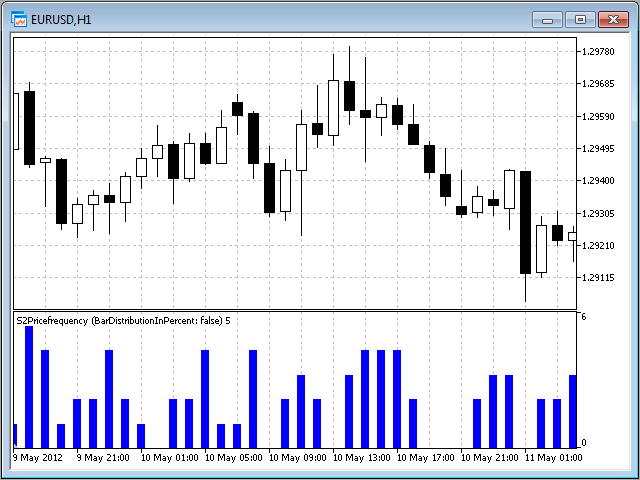
S2 Price Frequency indicates the number of repeating values ​​or percentage of the available size (height) at a predetermined interval. The resulting chart is a handy tool for market analysis.


Capabilities:


  • Set the number of the previous candle for comparison with the current.

  • Adjusting tolerance for each comparison.

  • The mapping diagram in two modes (in percentage or amount).

  • Plotting one of the seven indicators (Close, Open, Low, High, HLC3, HLoc4).


S2 Price Frequency

Related posts


  • Moving Average Price Level


    Moving Average Price Level Moving Average displaying price tags. settings Period MA - MA period; Shift MA - displacement of MA; Method MA - smoothing...


  • Custom Fractals HTF MT5


    Custom Fractals HTF MT5 It's no secret that for the market came to be sold when the market is at a maximum, and buy - at a minimum. To determine the...


  • ChannelTrend MT5


    ChannelTrend MT5 Indicator ChannelTrend - is a trading system that allows you to analyze the market in terms of several aspects of technical analysis....


Next posts


  • VIP Dynamic Support Resistance

  • Four Bands

  • MTF Money Flow Index

Tuesday, November 13, 2018

Average Spread

Average Spread


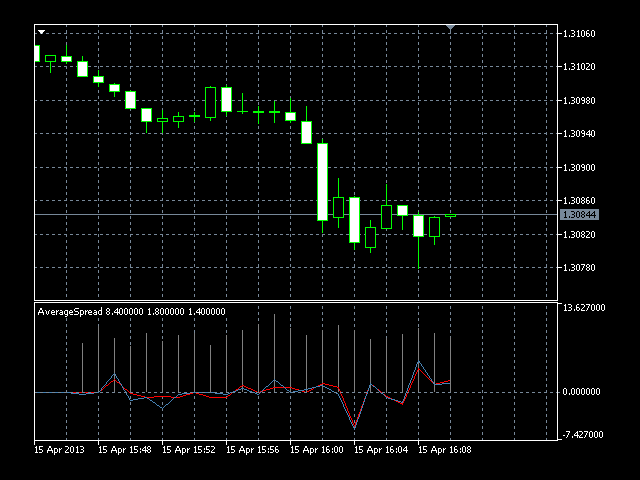
It is a tool for those who want to know exactly what is happening with your broker. It not only shows the average spread in real time (gray histogram), but the average price deviation Bid and Ask (red and blue lines). It shows what happens during high volatility, and allows you to adjust your trading strategy for your broker.


In the spread is often extended periods of high volatility. This indicator shows exactly how and what is happening.


provided parameter Smoothing Samples, where you can specify the number of samples to construct a medium in this indicator.


Please note that the LED will not work in the strategy tester, as required for the current data.
Average Spread

Related posts


  • Moving Average Price Level


    Moving Average Price Level Moving Average displaying price tags. settings Period MA - MA period; Shift MA - displacement of MA; Method MA - smoothing...


  • Extended Keltner Channel MT5


    Extended Keltner Channel MT5 Extended version of the Keltner Channel. You can use a variety of moving average 21 and 11 different prices to calculate the...


  • ImpBB


    ImpBB Standard indicator Bollinger Bands (Eng. Bollinger Bands) is calculated based on only 7 price constants and the simple moving average (SMA). This...


Next posts


  • S2 Price Frequency

  • VIP Dynamic Support Resistance

  • Four Bands

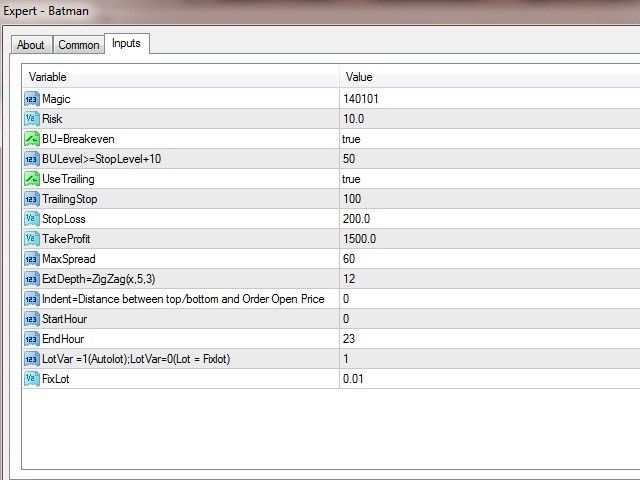
Batman

Batman Batman Advisor is based on a very simple system that uses ZigZag indicator and breakdown strategy. Transactions are opened only whe...