Average Spread
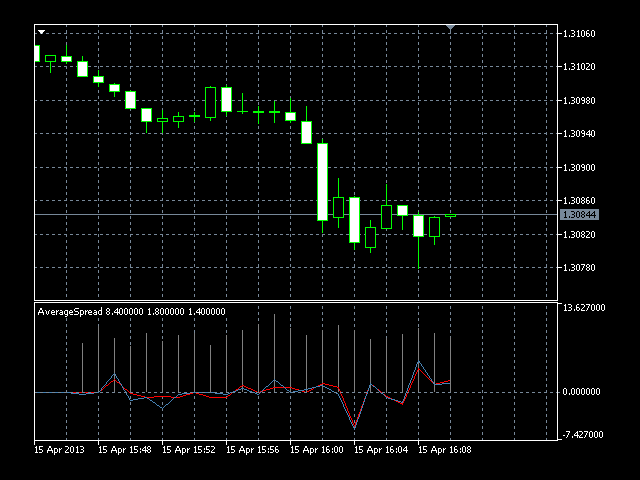
It is a tool for those who want to know exactly what is happening with your broker. It not only shows the average spread in real time (gray histogram), but the average price deviation Bid and Ask (red and blue lines). It shows what happens during high volatility, and allows you to adjust your trading strategy for your broker.
In the spread is often extended periods of high volatility. This indicator shows exactly how and what is happening.
provided parameter Smoothing Samples, where you can specify the number of samples to construct a medium in this indicator.
Please note that the LED will not work in the strategy tester, as required for the current data.

Related posts
Moving Average Price Level Moving Average displaying price tags. settings Period MA - MA period; Shift MA - displacement of MA; Method MA - smoothing...
Extended Keltner Channel MT5 Extended version of the Keltner Channel. You can use a variety of moving average 21 and 11 different prices to calculate the...
ImpBB Standard indicator Bollinger Bands (Eng. Bollinger Bands) is calculated based on only 7 price constants and the simple moving average (SMA). This...
Next posts
- S2 Price Frequency
- VIP Dynamic Support Resistance
- Four Bands

No comments:
Post a Comment