Showing posts with label Technical Indicators for MT4. Show all posts

Tuesday, December 24, 2019

GM Stochastic MIDL

GM Stochastic MIDL


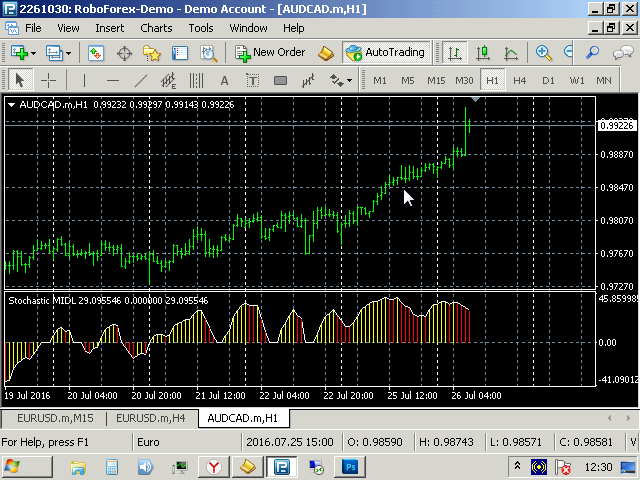
Indicator GM Stochastic MIDL It built on averaging two stochastics (7,3,4) and (20,3,7) from the level limiting. For this is the only option Lim.


Central operator indicator is


IIndBuffer [i] = ((iStochastic (NULL, 0,7,3,4, MODE_SMA, 0, MODE_MAIN, i) + iStochastic (NULL, 0,20,3,7, MODE_SMA, 0, MODE_MAIN, i)) / 2 -50)

indicator value after its implementation vary from -Y, through 0 to + Y. The white line. Indicator supplemented histogram growth indicator values ​​or descending.


Another important indicator is the operator


if (IIndBuffer [i] < Lim && IIndBuffer [i] > -Lim)
IIndBuffer [i] = 0;

Parameter Lim can be adjusted so that no part of the false movements.


The color histogram display is also configurable. Default - it is white, yellow and red. Yellow lines and a value greater than 0 - UP movement. Red lines and values ​​less than 0 - motion DOWN.


The intersection with the zero level may be a signal for the opening of the transaction in the appropriate direction.


GM Stochastic MIDL

Related posts


  • FW Stochastic MTF


    FW Stochastic MTF Stochastic indicator is the most used by traders. This version allows you to extract the maximum information without the hassle of...


  • Value Chart for MT4


    Value Chart for MT4 Value Charts (Helveg and Stendhal, 2002) - an innovative technology price display as a value, not the cost, even if the price...


  • NearLevels


    NearLevels LED displays random fractals and support / resistance levels constructed from them. Using an indicator you see a clearer picture of the market...


Next posts


Thursday, December 19, 2019

AnyCandleGroup

AnyCandleGroup


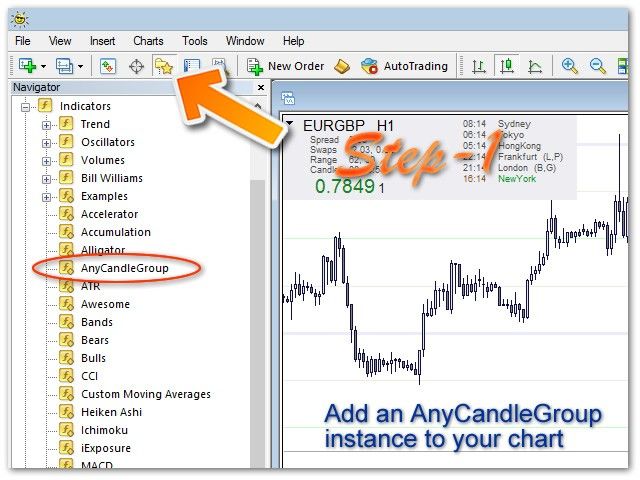
AnyCandleGroup displays candles H1, H4, D1 on the M15 chart.


Overview


The indicator shows the last 3 candles of any timeframe on the right side of the graph, and outputs a voice warning before the close of the candle. AnyCandleGroup prevents unnecessary clutter graphics data. The indicator is very useful if you consider the volume / spread when making trading decisions.


Capabilities


  • It displays the last 3 candles of any timeframe on the right side of the chart

  • Provides distinct voice alerts (in English) before the close of the candle (the audio files must be downloaded and installed separately)

  • Visual Alert is also used - a candle changes color before closing

  • trigger levels of alerts are configured in minutes and seconds, depending on your preference

  • The display can be switched on / off without removing it from the chart

  • The program is quite compact thanks to optimized code


installation


  1. Download AnyCandleGroup_v1.4.zip and Sounds.zip files.

  2. Unpack the ZIP-file into a temporary folder.

  3. Copy ex4-file in the folder:

    ..\ Users \ your-login-to-Windows \ AppData \ Roaming \ MetaQuotes \ Terminal \ xxx \ MQL4 \ Indicators

  4. Copy the WAV-files in the folder:

    ..\ Program Files (x86) \ MetaTrader \ sounds \


application


  1. Turn on the "Chart shift" in the MetaTrader toolbar.

  2. Start the AnyCandleGroup chart.

  3. Set the property value TimeFrame: AnyCandleGroup will display 3 candles specified timeframe (by default - H4).

  4. The value of the Position property should be changed only if you intend to use more than one indicator AnyCandleGroup on the same graph. Otherwise, leave the default value (7).

  5. Set the alert properties (Alarm): time and unit of measure (min = minutes; sec = second). Settings are not case sensitive, ie 5 min and 5 Min perceived equally (by default, the alert is turned off and is set to 5 minutes).

  6. Have a nice work!


Advice


  • You can add more than one copy AnyCandleGroup indicator on the same schedule. Let's say you open a graph M15, where you will also want to keep track of the last three candles with H4 charts, D1 and W1. In this case, you need to run on a schedule of three copies of the indicator. Do not forget to specify the Position property value for the second and third copies (7 leave for the first group of candles, set of 15 - second and 23 - for the third). Otherwise, the second and third spark over the first group are displayed.

  • Do not add more than three copies AnyCandleGroup one schedule (this is possible, but much sense to do so).

  • Activate alerts only one copy AnyCandleGroup indicator for a given timeframe to avoid duplicate alerts.


Example


You open a graph M15, where you will also want to keep track of the last three candles with H4 and D1 charts. In this case, you need to run two copies AnyCandleGroup on the chart and adjust them as follows:


H4 candle (AnyCandleGroup1):


  • Timeframe = H4

  • Position = 7

  • Alarm_On = true

  • AlarmStartBeforeClose = 5

  • AlarmStartMeasure = min


D1 candles (AnyCandleGroup2):


  • Timeframe = D

  • Position = 15

  • Alarm_On = false


FAQ


  1. In the "List of indicators" given that I run three copies AnyCandleGroup, but on the chart, I see only one. What is the reason?

    Position set to the same value for all copies AnyCandleGroup. Set a different value for each copy (see. Example 1).


  2. Sometimes on the chart appear unnecessary candles AnyCandleGroup. Why?

    This usually happens when your computer wakes from sleep mode and starts to update the MT4 charts. Since version 1.4, AnyCandleGroup conducts regular cleaning, which start within minutes after the resumption of MT4. You just need to wait a little longer. You can also just temporarily switch to another timeframe, and then return to the M15 (or any other that you had originally).


The indicator is free and is intended for personal use.


Good luck!


AnyCandleGroup

Related posts


  • AkenMFI


    AkenMFI AkenMFI intended for trading binary options on the timeframes M5 and M15. Oscillator AkenMFI closely linked to the indicators and AkenATR...


  • Pinbar Scanner With Trend Filter


    Pinbar Scanner With Trend Filter The indicator was created by the former employee of the hedge fund. It automatically determines the most probable pin...


  • Vola Alarm Free


    Vola Alarm Free Vola Alarm shows the current value of the price movement since the opening of the bar at a percentage of the average price movement ....


Next posts


Wednesday, December 11, 2019

VACrocodile

VACrocodile


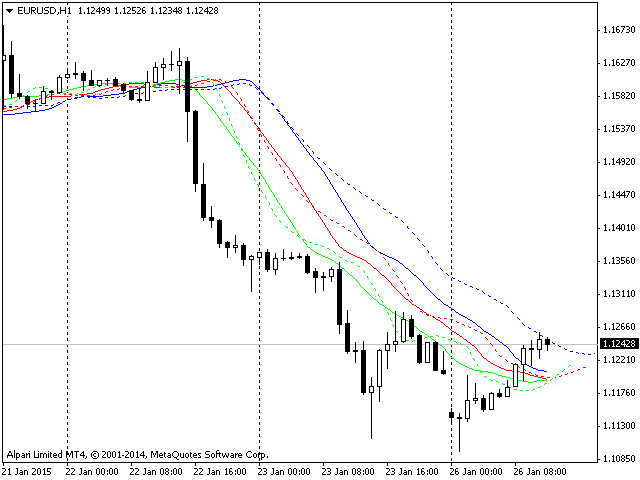
Analogue indicator "Alligator" B. Williams. But unlike the "Alligator" all moving averages are one period. Thus it was partly to get rid of the lag indicator.


In the screenshots you can see a comparison of the indicator "Alligator" (shown in dashed lines) with the default parameters and its equivalent, with a parameter for the moving averages - 15.


An indicator:


Period MA - period moving average;


MA metod - method of calculation of moving averages SMA, EMA, SSMA or LWMA.


VACrocodile

Related posts


  • DoubleMultiTimeFrameMA


    DoubleMultiTimeFrameMA Multiple timeframe indicator based on moving averages. You can adjust the parameters of the two moving averages that you see on...


  • Smart Moving Averages Indicator


    Smart Moving Averages Indicator Smart Moving Averages - exclusive indicator for MetaTrader platform. Instead of calculating the moving averages for the...


  • SqrtBands


    SqrtBands Indicator displays on the chart Bollinger bands constructed on the basis of the mean-square moving average lines. The screenshots show a...


Next posts


Tuesday, December 3, 2019

SR Key Breakout and Jump Levels

SR Key Breakout and Jump Levels


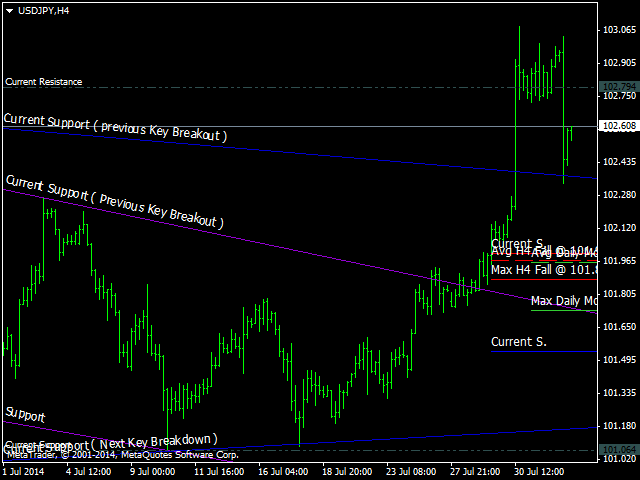
Key Breakout and Jump / Fall levels. Not late. It is not redrawn.


  1. The trend line is used to detect the pattern for the model "triangle", support and resistance lines, and how to break the line up or down. 

  2. Trend lines are formed before the pair reached its price. The line is not redrawn. 

  3. In each line there is a description, for example, Support, Current-Support as key breakout down, and Current-Resistance as a key breakout up. 

  4. Each punched line becomes the new level of support or resistance. Changes occur automatically in real time. 

  5. Nearest to the horizontal trendline support / resistance lines are the strongest. 


When a person is under pressure, and sometimes even under normal circumstances, you can forget about something trivial, but in fact important. Here, at the outset formed channel showing breakdowns. And when the price is in a period of consolidation, with lateral movement, people often forget about the triangle patterns. Ultimately, the come the breakdown of their surprise.


This indicator automatically draws the channel and pattern, and the breakdown of drawing the upper and lower limits. Scalpers and day traders mmogut use these indicators on H1 and H4 charts. At a higher timeframes indicator can be used for Swing-trading.


Use this indicator to mind, do not give up on a good MM, immediately lock the position when the relevant conditions. Because the market is not so simple. Better define all the signs and all the carefully considered before making trading decisions. Use the channel and signs of a breakdown, as well as the extent to which the price will bounce during high volatility. You no longer need to build the channels themselves, this indicator does everything for you.


SR Key Breakout and Jump Levels

Related posts


  • TR Breakout Patterns Scanner


    TR Breakout Patterns Scanner This price action indicator automates detection the breakdown of the trend patterns and patterns re-breakdown testing , and...


  • Fifth dimension MT4


    Fifth dimension MT4 Indicator searches and marked on the chart trading signals "Fifth Dimension". DETAILED DESCRIPTION graphical models forming trade...


  • Levels of Volatility


    The Levels of Volatility The indicator indicates support / resistance levels based on the volatility of the currency for a selected period (the number of...


Next posts


  • VACrocodile

  • AnyCandleGroup

  • GM Stochastic MIDL

Wednesday, November 27, 2019

TDI Direction Change Indicator

TDI Direction Change Indicator


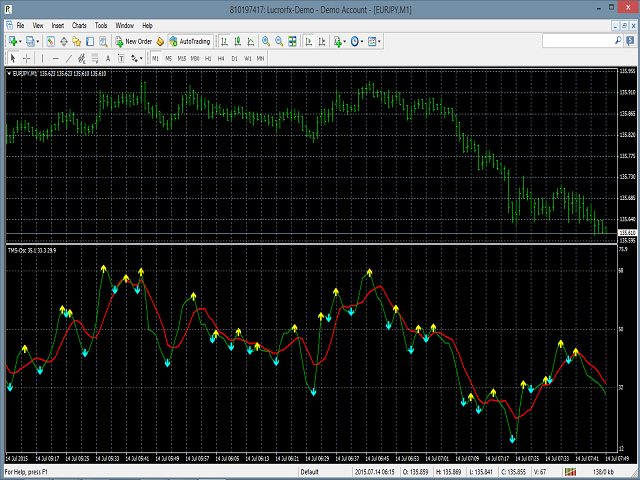
Indicator TDI Direction Change Indicator - an oscillator that determines the point of entry into the market for the placement of transactions, taking into account the value of RSI (Relative Strength Index - Relative Strength Index), the method of trading signal and the method of the mainstream market.


The parameters for the calculation of the indicator:


  1. RSI Period - RSI period 13 bars

  2. RSI Price - the price of RSI, the closing price

  3. RSI Signal Period - RSI period signal 2 Bar

  4. RSI Signal Method - RSI signal method, Simple

  5. Trade Signal Period - the period of the trading signal, 7 bars

  6. Trade Signal Method - the method of trading signal, Simple

  7. Market Base Period - the period of the primary market, 34 bar

  8. Market Base Method - the method of the mainstream market, Simple

  9. Arrow Size - the size of the arrows 1, arrows dimensions are adjusted up and down.

  10. Up Arrow Color - the color of the up arrow, yellow, the color of the up arrow is adjusted.

  11. Down Arrow Color - the color of the up arrow, sky blue, the color of the up arrow is adjusted.


Indicator TDI Direction Change determines the change in the direction of market movement.


It has the following properties:


  • Sharing RSI values, method of trading signal and the method of the mainstream market.

  • Drawing lines in a separate window.

  • Display of the up before the start of a downtrend.

  • Showing the down arrow just before the start of the upward trend.


TDI Direction Change Indicator

Related posts


  • Quantina Intelligence iTrend Indicator


    Quantina Intelligence iTrend Indicator 2015 Generates signals to buy / sell No longer need to read and decipher the lines of market trends in the...


  • Harmonic Trading Pro Indicator


    Harmonic Trading Pro Indicator Harmonic Trading Pro Indicator is unlike any other one harmonic light in the market . This harmonic light has a very...


  • FX Sniper Magenta


    FX Sniper Magenta FX Sniper Magenta - exclusive leading indicator , intended for trading currencies in the MetaTrader platform. FX Sniper Magenta can...


Next posts


  • SR Key Breakout and Jump Levels

  • VACrocodile

  • AnyCandleGroup

Friday, November 22, 2019

Fractal Candlestick and Pattern

Fractal Candlestick and Pattern finder PRO


The use of candles and fractals - a great, proven trading strategy, and the product - it is the most simple and versatile indicator.


Presented any patterns of candles and fractals. The sensitivity of each pattern is adjustable from 1 to 100, and if desired, you can set an alarm for each of them. The sensitivity range is calculated mathematically. Most traders use 50. However, if there is a successful trading system sensitivity change will help fine-tune your strategy.


Input parameters:


If true, the indicator appears on the chart, and set to false does not appear:


  • The basic fractal up (General Fractal Up)

  • Main down fractal (General Fractal Down)

  • Perfect fractal up (Perfect Fractal Up)

  • Perfect down fractal (Perfect Fractal Down)

  • Hammer (Hammer)

  • Shooting Star (Shooting Star)

  • Marubozu up (Marubozu Up)

  • Marubozu down (Marubozu Down)

  • doji (Dodges)

  • Spinner (Spinning Top)

  • Dodge dragon (Dragonfly Doji)

  • Dodge gravestone (Gravestone Doji)

  • Inverted hammer (Inverted Hammer)

  • Hanged man (Hanging Man)

  • Vertex stars (Star Top)

  • Star Bottom (Star Bottom)

  • Harami bottom up (Harami Down To Up)

  • Harami downward (Harami Up To Down)

  • Harami (Harami)

  • Penetrating the line up (Piercing Line Up)

  • The curtain of dark cloud (Dark Cloud Cover)


The following parameters can customize the color of each indicator in the chart:


  • General Fractal Up Color

  • General Fractal Down Color

  • Perfect Fractal Up Color

  • Perfect Fractal Down Color

  • Hammer Color

  • Shooting Star Color

  • Marubozu Up Color

  • Marubozu Down Color

  • Doji Color

  • SpinningTop Color

  • DragonFly Doji Color

  • GraveStone Doji Color

  • Inverted Hammer Color

  • Hanging Man Color

  • Star Top Color

  • Star Bottom Color

  • Harami Down To Up Color

  • Harami Up To Down Color

  • harami Color

  • PiercingLine Up Color

  • Dark Cloud Cover Color


The true meaning of the following options, you will be sent an alert when a any indicator:


  • General Fractal Up Alert

  • General Fractal Down Alert

  • Perfect Fractal Up Alert

  • Perfect Fractal Down Alert

  • Hammer Alert

  • Shooting Star Alert

  • Marubozu Up Alert

  • Marubozu Down Alert

  • Doji Alert

  • Spinning Top Alert

  • Dragonfly Doji Alert

  • Gravestone Doji Alert

  • Inverted Hammer Alert

  • Hanging Man Alert

  • Star Top Alert

  • Star Bottom Alert

  • Harami Down To Up Alert

  • Harami Up To Down Alert

  • harami Alert

  • PiercingLine Up Alert

  • Dark Cloud Cover Alert


The following parameters can be set in the range of 0-100, the default values ​​50. The higher the sensitivity, the less the signals, but that they are more powerful.


  • Hammer Sensitivity

  • Shooting Star Sensitivity

  • Marubozu Up Sensitivity

  • Marubozu Down Sensitivity

  • Doji Sensitivity

  • Spinning Top Sensitivity

  • DragonFly Doji Sensitivity

  • GraveStone Doji Sensitivity

  • Inverted Hammer Sensitivity

  • Hanging Man Sensitivity

  • PiercingLine Up Sensitivity

  • Dark Cloud Cover Sensitivity


About Fractal, Candlestick and pattern finder:


It really is the simplest and most universal indicator of its type. Just add an indicator to the chart and set the parameters.


Visit my website, where each candle and a way to trade with it is described in detail.


Also contact me via email if you think that in order to improve the necessary additions and I will update as soon as the indicator.


ollie.loney95@gmail.com


Thank you for attention. Oliver Lowney.


Fractal Candlestick and Pattern

Related posts


  • HC Candlestick Signal


    HC Candlestick Signal The indicator shows the potential entry points. It runs using RSI indicator candlenut and analysis. In addition to the signals in...


  • Pattern Informer PriceAction


    Pattern Informer PriceAction Pattern Informer - convenient indicator to recognize patterns Price Action on selected instruments. It allows visible in a...


  • Lines Resistance and Support


    Lines Resistance and Support The indicator shows the support / resistance levels are based on the price action on historical data. Required depth stories...


Next posts


  • TDI Direction Change Indicator

  • SR Key Breakout and Jump Levels

  • VACrocodile

Wednesday, November 13, 2019

Average Directional Movement Index

Average Directional Movement Index Based on Book


This indicator is the index of the average directed motion, which is calculated using the formula in the book Welles Wilder's "New Concepts in Technical Trading Systems". for MT4 indicator uses a different formula, which leads to different results.


Options


  • DMILength: Periods for calculating the Average Directional Movement Index.

  • ShowADX: Specify the value True to display the ADX line on the display.

  • ShowADXR: Specify the value True to display the ADXR line in the display.


To have a complete picture of the display, I recommend reading the book to the Welles Wilder's "New Concepts in Technical Trading Systems".


Average Directional Movement Index

Related posts


  • Moving Average fullshift


    Moving Average fullshift Moving average , which can be shifted not only to the right / to the left, but also up / down. It is also possible to select the...


  • Moving average crossover scanner


    Moving average crossover scanner This indicator determines when the fast moving average (MA) crosses the line of slow moving average. The period of slow...


  • MA Signal


    MA Signal Fairly simple and straightforward indicator that shows the intersection points of two Moving Average , but when used in some commercial systems...


Next posts


  • Fractal Candlestick and Pattern

  • TDI Direction Change Indicator

  • SR Key Breakout and Jump Levels

Friday, November 1, 2019

Aggregate Position

Aggregate Position


It calculates the cumulative position of all long positions and the aggregate position of all short positions on the current symbol. The total position is displayed in the graph by a horizontal line. When you hover the cursor on the line tooltip indicating the amount of the total position. It counts the total position when changing the total number of positions in the terminal.


Input parameters


  • BuyLine color - color line total long position;

  • BuyLine width - line thickness aggregate long position;

  • BuyLine background - draw a line total long positions as a background;

  • SellLine color - color line of total short position;

  • SellLine width - the total thickness of the line short position;

  • SellLine background - draw a line cumulative short position as a background.


Aggregate Position

Next posts


  • Average Directional Movement Index

  • Fractal Candlestick and Pattern

  • TDI Direction Change Indicator

Tuesday, October 29, 2019

MWC COX

MWC COX


The indicator shows the extreme field net short / long positions (extreme zones of net short / long positions) for four time periods. The default periods - 12, 26, 52 and 156 weeks.


Additional functions


- Display the sum of all 4 periods in one line


- built-in indicators MA, MOM and RSI


Place the file in the folder MWC_3L.dat [...] / MQL4 / Files. More detailed instructions can be downloaded here (in English).

The main data directory: www.myweeklycot.com/cot/voll/[Actual Year] / ...


Example: http://www.myweeklycot.com/cot/voll/2014/MWC_3L.dat


The file is updated once a week.


MWC COX

Related posts


  • KFX Support and Resistance


    KFX Support and Resistance The indicator shows the levels of support and resistance lines as the larger timeframes. It can be run on any timeframe, but...


  • Trending Bands


    Trending Bands Based on the moving average indicator Trending Bands It helps you find the best price and the time to enter the market in a safe...


  • Spread Live


    Spread Live LED displays spread directly from your broker . Existing pips on all charts, and a very simple indicator code. This indicator simply shows...


Next posts


  • Aggregate Position

  • Average Directional Movement Index

  • Fractal Candlestick and Pattern

Wednesday, October 23, 2019

Argo 1 2 3

Argo 1 2 3


The indicator is designed to recognize the price chart itself
"1-2-3" pattern is often found.
The pattern is displayed on a graph only after it is completely formed, the
there are price breaks point "2". Provided "Alert" or -opoveschenie warning beep only. Sound signal
is supplied, and a pin is placed when the price breaks pivot formed
indicator. On the screen, in addition to the pattern displayed pivot and target
the perceived price movement. Please note that the target
levels are calculated as a Fibonacci extension. You can change these settings. The indicator itself is building point for ZigZag, calculated according to the algorithm Murphy, so in the settings ZZ nothing but TF (timeframe), from which are taken
data.


Basic settings:


  • TF - timeframe.

  • ExtMaxBar -
    ELO number of bars (0-all).

  • ColorZZ - Color
    zigzag lines. Default - CLR_NONE.

  • StyleZZ - Style zigzag lines.

  • WidthZZ - The thickness of the zigzag lines.

  • Target_level_1 - The first target level.

  • Target_level_2 - A second target level.

  • Target_level_3 - The third target level.

  • WidthArrow - point size.

  • upArrow - Color Up points.

  • dnArrow - Color Dn points.

  • RetraceDepthMin - Min for the determination of "3".

  • RetraceDepthMax - Max to determine the point "3".

  • Both parameters are calculated
    from points of Fibo "1-2".

  • DellArrow - if "false", all the patterns are drawn and
    breaking point on the current portion; if the «true», it is only the past.

  • alertsOn - off the alert.

  • alertsSound - off
    Chime breakdown pivot.

  • Sound - the name of the sound file that will be
    sound when alertsSound = true.


Argo 1 2 3

Related posts


  • Geo Fractals


    Geo Fractals Professional fractals indicator . It provides operating mode "multiple screens" on a single open chart. Designed for scalpers and fans of...


  • Head Fake MT4


    Head Fake MT4 Reversal strategy pattern "head" determines the probable point of price reversal. Column histogram upward indicates a bullish reversal...


  • ChangingTrends


    ChangingTrends The indicator calculates the most likely area stop / reversal of the trend , zone self trend movements . Are taken into account: the rate...


Next posts


  • MWC COX

  • Aggregate Position

  • Average Directional Movement Index

Thursday, October 10, 2019

PZ Absolute Gains

PZ Absolute Gains


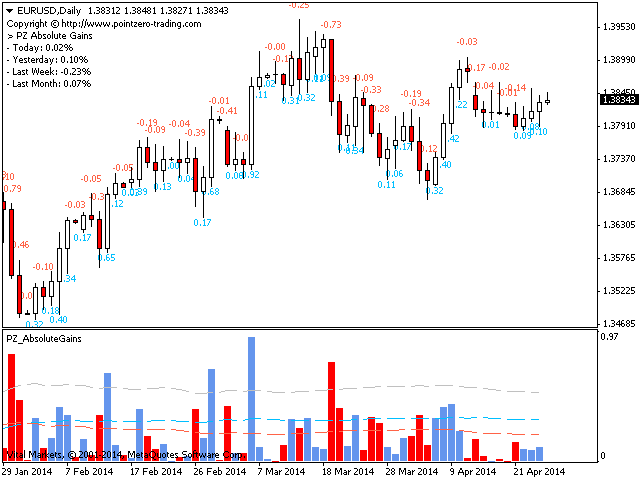
Indicator Pz Absolute Gains counts as a symbol of rose or fell as a percentage value for a certain period of time.


  • It allows you to define market models

  • Identifies key price movement

  • It displays the state of overbought / oversold


The indicator is simple to interpret ...


  • Blue histogram represents bull bars

  • Red histogram represents bear bars

  • The blue line shows the average value of the bull bar

  • The red line shows the average value of a bear bar

  • The gray line shows the overbought / oversold


...and in the application.


  • You need to buy when a bar oversold

  • Need to sell when a bar in overbought

  • You need to buy when a key bull bar

  • Need to sell when a key bearish bar


Author


Arturo Lopez Perez, a private investor, speculator, programmer and founder of Point Zero Trading Solutions.


PZ Absolute Gains

Related posts


  • OneTM TrendFinder


    OneTM TrendFinder The indicator uses a complex algorithm for calculating the ratio of RSI and moving averages. The values ​​of the RSI indicator is used...


  • Multicurrency Cross Oscillator


    Multicurrency Cross Oscillator Description Color universal indicator / oscillator crossing moving averages. It is possible to raise or lower coloring...


  • RSI Global


    RSI Global Description Universal indicator RSI together with the sliding means on its base. Depending upon the need or desire moving averages may be...


Next posts


  • Argo 1 2 3

  • MWC COX

  • Aggregate Position

Tuesday, October 8, 2019

Woltec

Woltec


The indicator is designed for lovers of pipsing. The indicator is based on a mathematical calculation: determined percentage range of the price channel usually, this range is generated at the time of storage positions. When the price goes beyond it, a signal is generated in the form of points. A feature of the indicator is the minimum settings - is the frequency of the signal is less than the value of the indicator gives more signals.


Options:


  • Multiplier - frequency signals (the smaller the value the greater the frequency signals).

  • Notification - choice Alert notifications (pop-up), sending to Email, Push-notifications.


Woltec

Related posts


  • PTS Precision Index Oscillator


    PTS Precision Index Oscillator Indicator Precision Index Oscillator (Pi-Osc) provides accurate time trading signals, based on multilateral analysis of...


  • MA Statistics


    MA Statistics The indicator calculates certain statistical data relating to the moving average (MA) and price . Statistics associated with points...


  • Smart Price Oscillator


    Smart Price Oscillator Indicator (oscillator) analyzes price bars predetermined period and shows probable change of direction (correction). Rise and fall...


Next posts


  • PZ Absolute Gains

  • Argo 1 2 3

  • MWC COX

Wednesday, October 2, 2019

Super Volume Trend

Super Volume Trend


Super Volume Trend indicator uses a set of algorithms and indicators. The purpose of the indicator - the search for reliable trends to specific changes in volume. When searching for used sorting systems.


The indicator is simple to learn and use. The other indicators are not needed. However, users can use it in conjunction with other indicators that fit their strategy.


application


  • period settings are set so that the indicator bars to cross the signal lines.

  • If the blue bars are closed over the signal line, the bullish trend begins.

  • If the red bars are closed on the signal line level, it starts the bearish trend.

  • Alerts let you know in due time all the bars crossing the signal line.

  • It is also possible to send emails and push-notifications.


Options


  • Period - the standard period

  • Forceperiod - to override period


  • Signal_level - signal level

  • AlertsOn - enable / disable alerts. Enabling affects all types of notifications

  • AlertsOnCurrent - enable / disable alerts on the screen

  • Alerts message - enable / disable alerts in the form of posts

  • AlertsSound - enable / disable audible alerts

  • AlertsEmail - enable / disable alerts via e-mail

  • AlertsNotification - enable / disable push-notification


Super Volume Trend

Related posts


  • RSI Trend Filtering


    RSI Trend Filtering This indicator is designed to filter trends. Known to many uses RSI indicator. This indicator is designed to confirm the trend. It...


  • Quantum Trend Volume


    Quantum Trend Volume Determine the current trend is one of the most important tasks of the trader, regardless of trading style. Indicator Quantum Trend...


  • Trend Beads


    Trend Beads Trend Beads indicator does not contain a trend indicators, such as moving average or Bollinger. The indicator only works with the movements...


Next posts


  • Woltec

  • PZ Absolute Gains

  • Argo 1 2 3

Monday, September 23, 2019

Candle close timer demo

Candle close timer demo


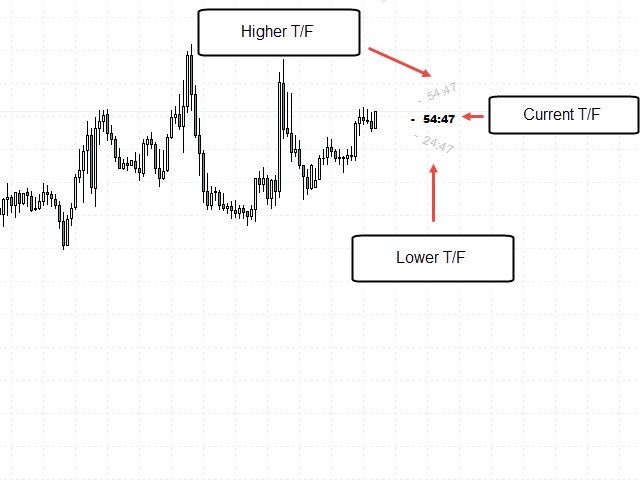
The indicator determines the time before the end of the current candle. The indicator can show both the time before the end of only the current candle and the time until the end of the candles on one timeframe older and one younger timeframe.


Attention: This is the demo version of the indicator. It is intended for testing and a stripped-down functionality. It works only on EURUSD.


The full version can be found here: https://www.mql5.com/ru/market/product/9737


Options


  • Higher - Font color for the senior timeframe;

  • Current - Font color for the current timeframe;

  • Lower - Font color for the smaller timeframe;

  • Show_High - Show time or not until the end of the senior timeframe;

  • Show_Low - Show time or not until the end of the smaller timeframe.


Candle close timer demo

Video


Related posts


  • TIL New Bar Timer Indicator DEMO


    TIL New Bar Timer Indicator DEMO This is the demo version of the indicator TIL New Bar Timer Indicator . This version of the indicator can be run on the...


  • Time Remaining Pro


    Time Remaining Pro So useful that once you try it, you'll wonder why it is not built in MetaTrader 4. The most advanced LED candles reverse countdown...


  • Trend Power demo


    Trend Power demo A very powerful tool that analyzes the direction and strength of the trend of 8 major world currencies: EUR, GBP, AUD, NZD, CAD, CHF,...


Next posts


  • Super Volume Trend

  • Woltec

  • PZ Absolute Gains

Tuesday, September 17, 2019

Volatility Chart

Volatility Chart


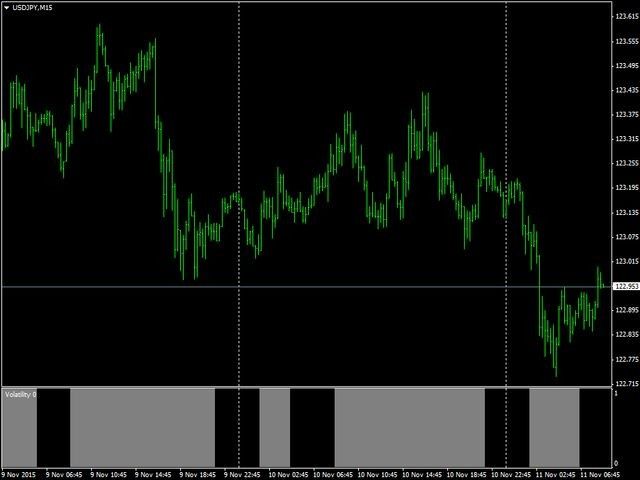
Volatility Indicator can display the graph volatility of the currency pairs.


The indicator can help avoid irregular transactions Detrended periods.


It can be used for FOREX instruments, and for binary options. Indicator values ​​may receive adviser.


indicator settings


  • BarsBack - the number of bars for analysis.

  • Flatery- fine tuning (default 0.25)


Volatility Chart

Related posts


  • Levels of Volatility


    The Levels of Volatility The indicator indicates support / resistance levels based on the volatility of the currency for a selected period (the number of...


  • Value Chart for MT4


    Value Chart for MT4 Value Charts (Helveg and Stendhal, 2002) - an innovative technology price display as a value, not the cost, even if the price...


  • CCI ma Multi anyPair


    CCI ma Multi anyPair kind of indicator CCI ma eight pairs. Default couples: AUDUSD, NZDUSD, USDCAD, EURUSD, USDCHF, GBPUSD, USDJPY and EURJPY. You can...


Next posts


  • Candle close timer demo

  • Super Volume Trend

  • Woltec

Wednesday, September 11, 2019

Strength Box

Strength Box


Strength Box - easy-to-use indicator. It displays the trends and is based on the relative strength index (Relative Strength Index, RSI).


Features

20 and 80 - a dangerous zone (confirmation rebound trend)


30 and 70 - zone decision (likely bounce rates)


50 - neutral zone


Good luck!


Strength Box

Related posts


  • AFX RSI Trendline


    AFX RSI Trendline AFX RSI Trendline automatically draws all the trend lines based on the indicator RSI. Features Indicator AFX RSI Trendline The...


  • Pinbar Scanner With Trend Filter


    Pinbar Scanner With Trend Filter The indicator was created by the former employee of the hedge fund. It automatically determines the most probable pin...


  • ChangingTrends


    ChangingTrends The indicator calculates the most likely area stop / reversal of the trend , zone self trend movements . Are taken into account: the rate...


Next posts


  • Volatility Chart

  • Candle close timer demo

  • Super Volume Trend

Tuesday, September 3, 2019

TIL New Bar Timer Indicator DEMO

TIL New Bar Timer Indicator DEMO


This is the demo version of the indicator TIL New Bar Timer Indicator. This version of the indicator can be run on the timeframes M5, H4, and MN.

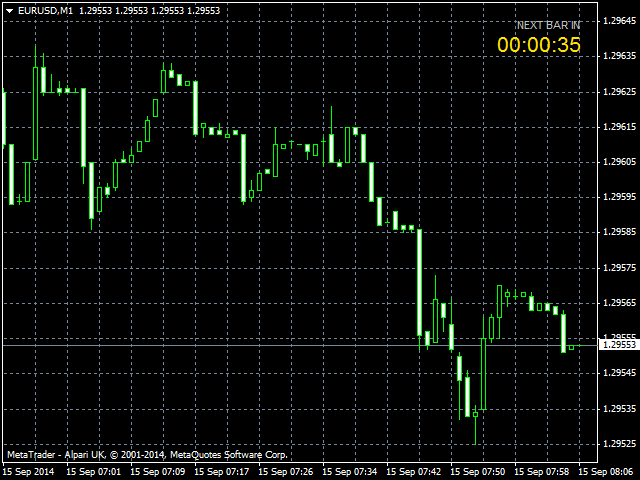
Indicator TIL New Bar Timer performs a single, but very important task - it displays the time remaining until a new bar on any timeframe. This indicator allows you to effectively prepare for the inputs or outputs, since timing is everything. TIL New Bar Timer is also gradually change color when the timer to zero. Due to this, the user can estimate the remaining time at a glance. timer changes occur in three main colors:


  • Red - this means that a new bar has just been formed, and the timer is reset.

  • Yellow - this means that a new bar formed by half since the beginning of the timer. Please note that the timer indicates the time relative to the current timeframe. For example, if the selected timeframe M1, the timer will be yellow for 30 seconds.

  • Green - this means that the new bar is formed after a few seconds. The user must be at the ready when the timer is becoming green.


It is possible to change the position of the indicator TIL New Bar Timer on the chart, and add sound notification of the formation of a new bar. The following input parameters are used for this:


  • Position - Timer position on the chart, you have two options:

    • UPPER_RIGHT_CORNER - upper right corner (default);

    • UPPER_LEFT_CORNER - verzny left corner.


  • Sound Alert - if the parameter is set to true, the formation of a new bar will play a sound alert.


TIL New Bar Timer Indicator DEMO

Related posts


  • Smart Moving Averages Indicator


    Smart Moving Averages Indicator Smart Moving Averages - exclusive indicator for MetaTrader platform. Instead of calculating the moving averages for the...


  • Buy Sell Indicator


    Buy Sell Indicator LED indicates the moments when you need to buy (blue arrow) or sell (orange arrow). It has two input parameters: barsNumber - the...


  • Time Remaining Pro


    Time Remaining Pro So useful that once you try it, you'll wonder why it is not built in MetaTrader 4. The most advanced LED candles reverse countdown...


Next posts


  • Strength Box

  • Volatility Chart

  • Candle close timer demo

Thursday, August 22, 2019

Trend Power demo

Trend Power demo


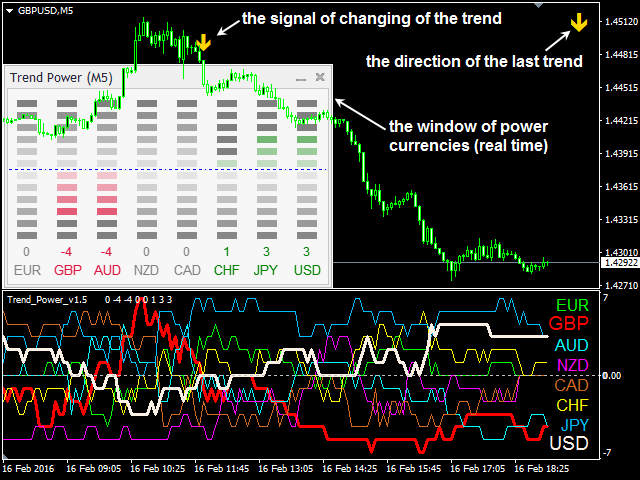
A very powerful tool that analyzes the direction and strength of the trend of 8 major world currencies: EUR, GBP, AUD, NZD, CAD, CHF, JPY, USD - in real-time and historical data. The indicator gives a beep and a message at a change of the trend.


The strength of the trend is calculated for all pairs, which include these currency (total 28 pairs) can take values ​​from 0 to 6 for a bullish trend, and from 0 to -6 in a bearish trend.


So you never miss a good move. By placing the indicator on the chart one currency pair, you follow the trend in the 28-instruments.


This Demo version indicator "Trend Power"I am fully functional on GBPUSD (history + + real-time signals).


Other instruments can be viewed only on the signals of history (the 20 bars). The current strength of the trend in the other instruments is not monitored and is removed from the window of 1 minute after the download progress bar.


Full version of the indicator and description of the features can be found here.


How to interpret the strength of currencies:


(Here is an example of currency strength to the bullish trend for the bear - the value will be negative)


  • 0-2 - the currency in the lateral movement (the flat)

  • 3-4 - the currency in good trending move, the optimal trade

  • 5-6 - a very strong trend, a correction


The greater the difference of strength between the two currencies, the stronger the trend of the currency pair, which consists of these currencies.


Example of use:


  1. crossing signal strengths of the two lines currencies - a trend change signal. It allows you to take most of the trend, but there may be false inputs when the market the flat or very sharp price fluctuations. It is recommended to wait for the pullback to test.

  2. Based on current indications of force without using a signal (more reliable way). In the current power window find the currency strong currency (the largest positive value trend force) and the weakest currency (the most negative trend). As a rule, the tool, which includes the currency is in a very strong trend. You should always wait for the correction to enter.


Note!


indicator signals should not be used for direct entry into the market!


By the time of occurrence of the signal, as a rule, it has already developed a strong trend, so it is necessary to wait for the pullback and enter the market at the current junior or TF on the testimony of other indicators, such as Trend Monitor.


Options:


  • Counting bars - the number of bars for the calculation history

  • Symbol Prefix - prefix for the custom name of the currency pair symbol

  • Symbol Suffix - suffix


  • Color of UP-trend signal - the color of the arrow of the bullish trend

  • Color of DOWN-trend signal - the color of the arrows bearish trend

  • Size of Signal's Arrows (0 - disable) - the size of the arrows that indicate a change in trend (if = 0 - not displayed)

  • Size of the Arrow of the trend's direction (0 - disable) - the size of the trend arrow in the upper right corner (if = 0 - not displayed)

  • Color EUR, Color GBP, Color AUD, Color NZD, Color CAD, Color CHF, Color JPY, Color USD - color strength of the trend lines of 8 currencies in subwindow indicator


  • ON / OFF - Sound when the signal - resolution of the audio signal

  • Sound of formation of the trend - the sound of a trend change signal

  • ON / OFF - Alert - posts in the terminal when changing trend

  • ON / OFF - Mail - sending messages to e-mail

  • ON / OFF - Push - push-send messages to mobile devices


It is extremely important to have a complete historical data of 28 currency pairs, different indicator readings will be incorrect!


Indicator can you retrieve historical data. But it takes a long time (up to 3 minutes, depending on the upload speed). Therefore, to speed indicator and correctly display the data before the first start indicator it is strongly recommended to run a free script «Download Quotes», which automatically connect the instrument to the window MarketWatch terminal and download historical data for all 28 currency pairs on all timeframes.


This procedure needs to be done only once before the first run indicator.

Trend Power demo

Related posts


  • Trend Power


    Trend Power A very powerful tool that analyzes the direction and strength of the trend of 8 major world currencies: EUR, GBP, AUD, NZD, CAD, CHF, JPY,...


  • Tesla Power Trends


    Tesla Power Trends Tesla Power Trends - it is simple and visual indicator that works with the most probable combinations and predicting space passing...


  • Alpha Trend


    Alpha Trend Alpha Trend - This trend indicator for MT4 platform, developed by a group of professional traders. Indicator Alpha Trend It is the most...


Next posts


  • TIL New Bar Timer Indicator DEMO

  • Strength Box

  • Volatility Chart

Monday, August 19, 2019

Pivot Point Scanner For Multi

Pivot Point Scanner For Multi Pair


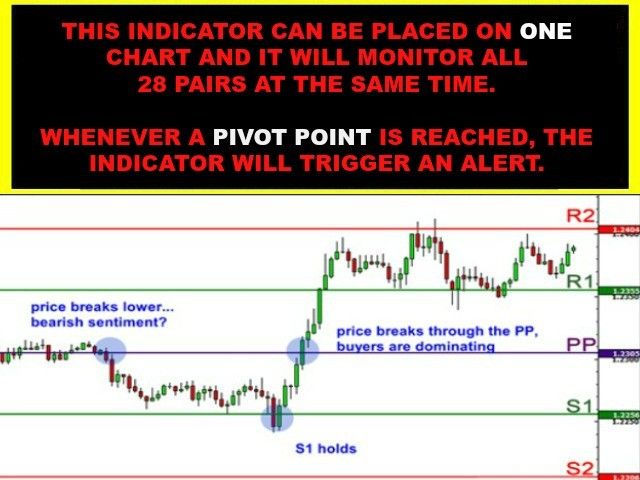
The indicator was developed by the former employee of the hedge fund, and it automatically detects when prices reached their levels of turning points. This indicator must be installed only on one chart, and it will simultaneously track up to all 28 pairs. And you can choose how many pairs of track. You can also choose from a variety of methods for calculating pivot points. Including Classic (Classic) pivot points Camarilla (Camarilla), Woody (Woodie's), Demark and Fibonacci.


Remember: For many years, traders and market makers use pivot points to determine critical support and resistance levels. And these levels often act as price barriers, which may accumulate a large number of orders. Thus, these levels may be used to determine the inputs / outputs and also to provide a very strong risk ratio and yield.


This indicator focuses on the D1 timeframe, since this is the most important time frame for strategies pivot points among institutional traders.


Features indicator


  • It can simultaneously monitor all 28 pairs. Attach the light to just one plan and immediately track the entire market.

  • You have complete control over the amount of steam being tracked.

  • Delivers the notification in real time every time when reaching a specified level.

  • You can choose from a variety of methods for calculating pivot points. Including Classic (Classic) pivot points Camarilla (Camarilla), Woody (Woodie's), Demark and Fibonacci.


Item display


  • Pivot Type: Selection method of calculation pivot points. Standard (Standard), Camarilla (Camarilla), Woody (Woodie's), Demark, or Fibonacci.

  • Symbols: By default, the indicator tracks the top 28 pairs, but you can specify a smaller number of pairs if desired.

  • Alert Interval Minutes: Timeframe to receive notification on a particular pair.

  • For example: Do you want to be alerted every time the price will reach the level of the turn? Or you want to be notified only once every 'X' minutes? This option allows you to select it.


For more information, I recommend to familiarize with screenshots below. If you have questions, please contact us.


Be sure to check out the rest of our indicators and our short video. In these videos contain a lot more information (including our guidance for trade).


Pivot Point Scanner For Multi

Related posts


  • Double Top Scanner For Multi Pair


    Double Top Scanner For Multi Pair And MTF The indicator was developed by the former employee of the hedge fund, and it automatically detects the pattern...


  • Turning Point Detector MT4


    Turning Point Detector MT4 The trajectory of the financial market movements are similar to the polynomial Distortions of the presence of random...


  • TR Breakout Patterns Scanner


    TR Breakout Patterns Scanner This price action indicator automates detection the breakdown of the trend patterns and patterns re-breakdown testing , and...


Next posts


  • Trend Power demo

  • TIL New Bar Timer Indicator DEMO

  • Strength Box

Friday, August 9, 2019

Angular Momentum Indicator

Angular Momentum Indicator


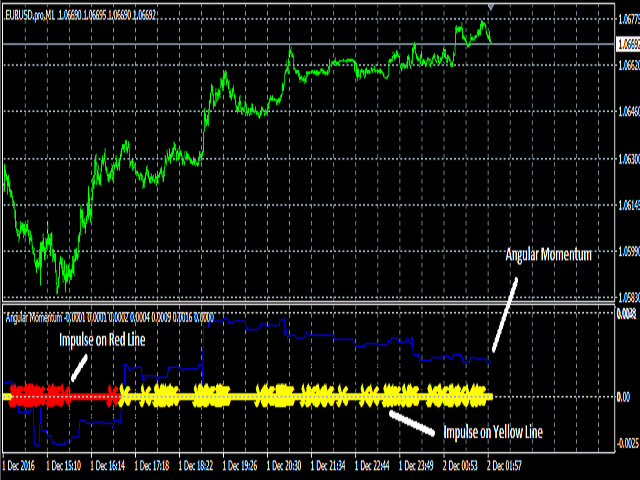
Nepererisovyvayuschiysya indicator, based on the total angular momentum of price levels from M1 to H1.


It is sensitive to changes in the angular momentum on the lower periods.


  • Yellow line - on an uptrend market

  • Red line - on the downtrend market

  • Blue line - the angular momentum

  • Crosses - impulses arising during the existence of the trend on the market. (You can enable / disable sending notifications.)


This indicator can be used on any timeframe from M1 to H1 without the need to configure any period moving averages.


Instructions for use


Long Trades:


  • When the yellow line, wait until the blue line reaches the minimum point. Trade only when it begins to move upward.

  • When the color of the yellow line turns red, you need to try to close those deals, which are open in the direction opposite to the movement of the probable market.


Short Trades:


  • When the red line, wait until the blue line reaches the maximum point. Trade only when it begins to move upward.

  • When the color of the red line changes to yellow, you need to try to close those deals, which are open in the direction opposite to the movement of the probable market.


Requirements: Please make sure that you have the ZigZag indicator, as this indicator is based on it.


Angular Momentum Indicator

Related posts


  • Indicator Combine Merge by Runwis


    Indicator Combine Merge by RunwiseFX It allows you to combine multiple indicators in one both visually and in alerts. These can be standard indicators...


  • Harmonic Trading Pro Indicator


    Harmonic Trading Pro Indicator Harmonic Trading Pro Indicator is unlike any other one harmonic light in the market . This harmonic light has a very...


  • Momentum solo


    Momentum solo Features is not redrawn The signal after closure The signals do not overlap Several periods will be hidden sideways The indicator will...


Next posts


  • Pivot Point Scanner For Multi

  • Trend Power demo

  • TIL New Bar Timer Indicator DEMO

Batman

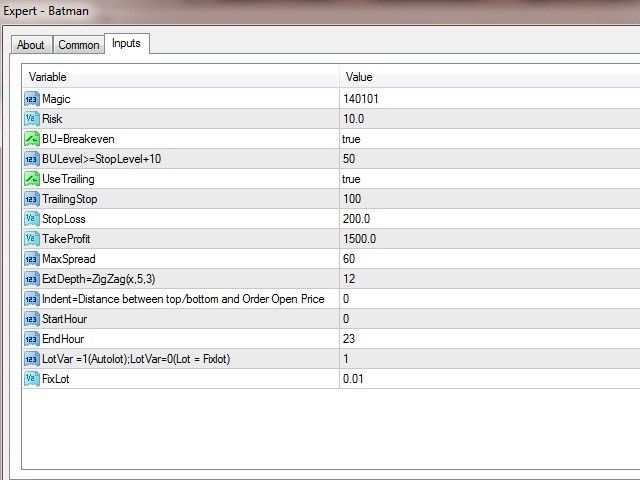
Batman Batman Advisor is based on a very simple system that uses ZigZag indicator and breakdown strategy. Transactions are opened only whe...