KFX Support and Resistance
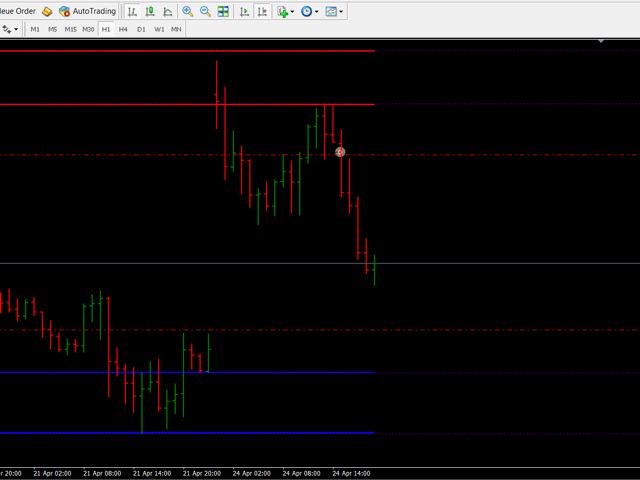
The indicator shows the levels of support and resistance lines as the larger timeframes. It can be run on any timeframe, but will appear only data timeframes H1-W1. Therefore, the indicator is well suited for small tayfreymov to search for inputs when price movement of line.
The screenshots show the actual trading situations, using KFX Trade Plotter.
The use of the indicator in the chart analysis
Select indicator for displaying (H1, H4, D1 or W1). The indicator also displays the time of the candle. I use the indicator on the M15. On the last screenshot briefly mentioned, how to analyze the currency pair and choose the best entry point. Usually I am looking for a minimum of three confirmation:
- Price observes line support and resistance
- RSI shows a divergence
- Candles form a W or M, price touches support and resistance lines 2 times
Options
- Candle_Closing_Time - closing candles
- location - select to display 1-4 times (schedule angle)
- displayservertime - 1 at close to the time of closing the candle displays server time
- fontSize - font size
- SHOW_H1 - enable / disable the H1 line
- SHOW_H4 - enable / disable the H4 line
- SHOW_D1 - enable / disable line D1
- SHOW_W1- enable / disable line W1
- Supply_Demand_Area - the size of the support / resistance lines
- All colors are set

Related posts
Better Support Resistance Better Support Resistance shows the optimal support line and / resistance zone. It is based on fractals (Fractals) you selected...
Trapezoidal Support and Resist
Trapezoidal Support and Resistance Support and resistance levels - the point at which the price trend may stop and turn around - is widely used for...
PipSeek for MT4 Analog indicator PeepSeek. Dynamic trohperiodnye exponential levels act as support or resistance , as indicated by the short-term price...
Next posts
- Impulse Checker
- FX Compass
- Forecast Angle

No comments:
Post a Comment