OneTM TrendFinder
The indicator uses a complex algorithm for calculating the ratio of RSI and moving averages.
The values of the RSI indicator is used in the calculation of multiple moving averages to detect a trend and neutral zones. The system generates signals based on the interaction of three exponential moving averages (EMA) and RSI.
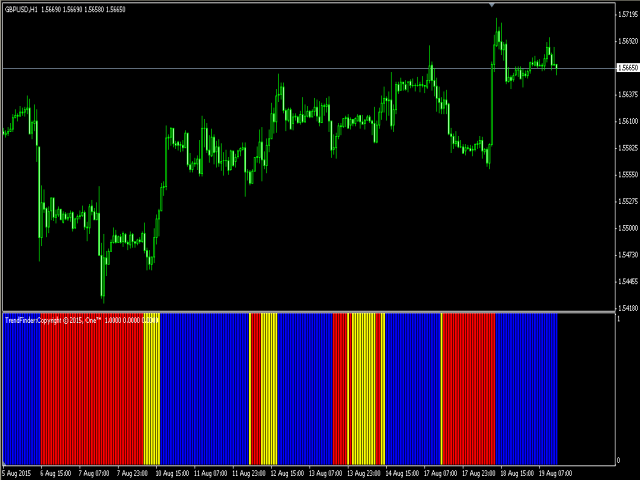
The signals are displayed on a histogram as red, blue and yellow bars. The blue bar indicates a bullish trend and the possibility of buying. Out of the market should be the appearance of yellow or red bar. Reverse (by a red bar) for the right of sell orders. Yellow bar indicates to the flat state of the market and the inability to determine its future direction. In this case, it is better not to enter the market.
- trend detection system to avoid the market "noise."
- Effectively displays trend and to the flat area (red bars indicate a bear market, blue - a bull, yellow - on to the flat).
- Well suited for Scalping trade.
- It is not redrawn.
- It does not change the previous data.
- Not recalculated.
- Signals are generated strictly at the close of each bar.
- It may be part of the advisor.
Options
- RSI_Period: The number of days for calculation of RSI.
- Fast_RSI_MA: The period of the fast moving average for RSI.
- Slow_RSI_MA: Period of slow moving average for RSI.
- RSI_MA_Method: The moving average method for RSI (default - EMA).
- -RSI_MA_AppliedPrice: Type RSI prices (by default - the closing price).
- Up_Color, Down_Color, Neutral_Color: Color bull, bear, and to the flat bars.
- Up_Width, Down_Width, Neutral_Width: Histogram width.
There are also options of color graphics and types of alerts (pop-up window notification, and email) with the ability to enable / disable.

Related posts
MarketMeter It is easy to use for multiple timeframe indicator cluster analysis of these currencies. It provides a simple but at the same time effective...
NewBbandsMT4 Probably every trader known indicator Bollinger Bands (Bollinger Bands). This indicator is similar to moving average envelopes, but based on...
Multicurrency Cross Oscillator
Multicurrency Cross Oscillator Description Color universal indicator / oscillator crossing moving averages. It is possible to raise or lower coloring...
Next posts
- Bollinger Histogram
- MA Swing High Single Time Frame
- Analyzer PRO

No comments:
Post a Comment