Silver or stagnation over
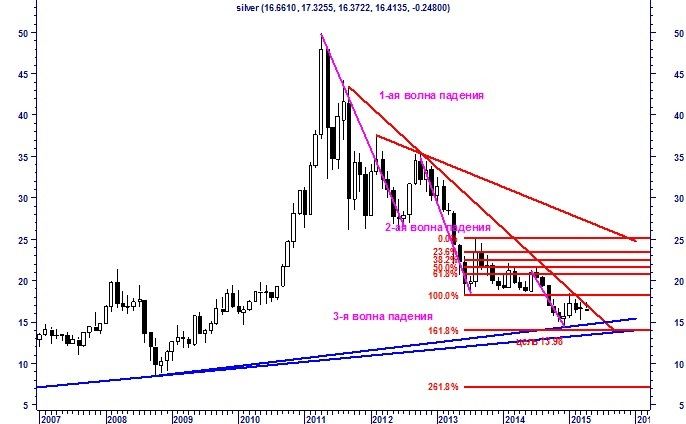
monthly graph
March finished in silver in a symbolic plus (+ 0.37% to 16.6615) and "April" this week went to a minus. The revival of sommodities after a weak March employment report (released on April 3) in the US was replaced by retrograde motion as soon as the dollar on Wednesday, April 8 became stronger. Strengthening dollar and falling metals began even before the release of the Fed meeting minutes of March 18, but after the release of data on the unexpected fall in industrial orders in Germany - fall is the second consecutive month. Again the Greek theme featured in media headlines. Minutes of the Fed later confirmed the bullish move in the dollar, because there were some people among the members of the Open Market (FOMC) Committee, which called for a rate hike in June. Although the market is still waiting for an increase in US interest rates in September, the desire to buy dollars won. Downward movement in precious metals may also be fueled by a sharp decline in oil prices after data record growth in US oil inventories.
On the monthly chart of silver is observed massive picture of the growing interest in silver until 2011. and loss of interest in it since 2011. In the fall of 2011 after. there are three waves, which successively decrease in size. Currently, the line of aggressive reduction highs tends to the intersection with the long-term rising support line near $ 14 an ounce. At monthly chart current sample level is allocated for a local minimum 18.23. The first goal of breaking Fibonacci - 13.98 - still not achieved. silver price "managed" to run only until December 14.2885 minimum. The issue of testing this minimum and access to a level of 13.98 will be charged if the price of silver will begin to close the accounting period (month) above 18.23.
Weekly schedule
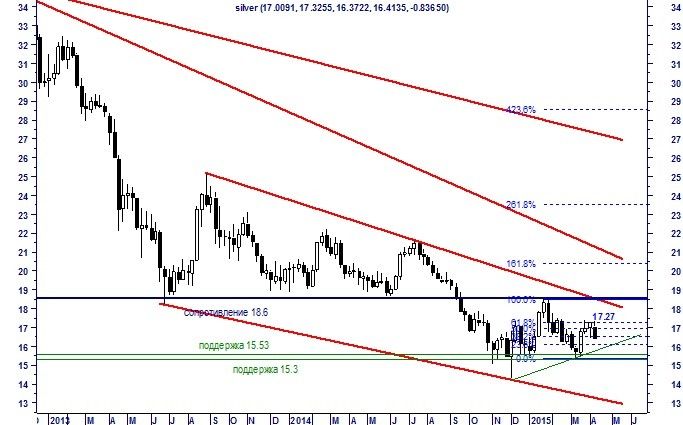
On the weekly chart shows that the price has done in March 2015 as part of the range. rebound 61.8% Fibonacci retracement (17.27), showing the local maximum at 17.4195. This week the price closes below 16.89 is likely - the middle of the 2015 range. After the March rebound in April, the price will fall back to the middle of the previous growth (16.3575), indicating that the price consolidation in the range of 15.3-17.42. On the strong support of 15.53 and 15.3 are shown weekly chart
In 2013. on silver formed a moderate downward corridor. Within its framework, yet it stands out technical resistance 18.6, but in May, the upper limit of the corridor falls to $ 18 an ounce. local minimum level (18.6375) in May 2014., which was knocked down in September 2014. In late January of this level has been tested as a resistance to the wave of interest in precious metals (gold and silver) in the face of the threat of a Greek exit from the eurozone. Recession fears over a Greek exit from the eurozone and expectations the US Federal Reserve raise interest rates in 2015. did not allow the price of silver to test this resistance to aggressive manner.
The daily chart

The price of silver at the end of March or beginning of April drew the formation of a double top. The movement of prices down 9 April (after the publication of the Fed's minutes of 18 March) raises the question of breaking through the support 16.45. The first target of this break Fibonacci 15.92
In the last review, we have argued that "in the end of March the price of silver has defined its range in the 16.45-17.42 area. Below it there is support for 16.1. "
Related posts
USD / RUB In the last days of a bygone weeks ruble showed weakness of the ruble crash when stable oil prices may indicate the possible start selling...
Forex ee Economic Daily Digest
Forex.ee: Economic Daily Digest Daily Digest of economic Forex . ee Keep an eye on major economic news with us Thursday, the 14 th of July GBP / USD...
Forecast for coming week on DAX
The forecast for the coming week on the DAX! In the long term DAX expects the decline up to 6200. In this chart pattern shows us head and shoulders month...
Next posts
- Why is American dream can fall
- Ruble has fallen sharply against
- US trading closed in green zone


No comments:
Post a Comment