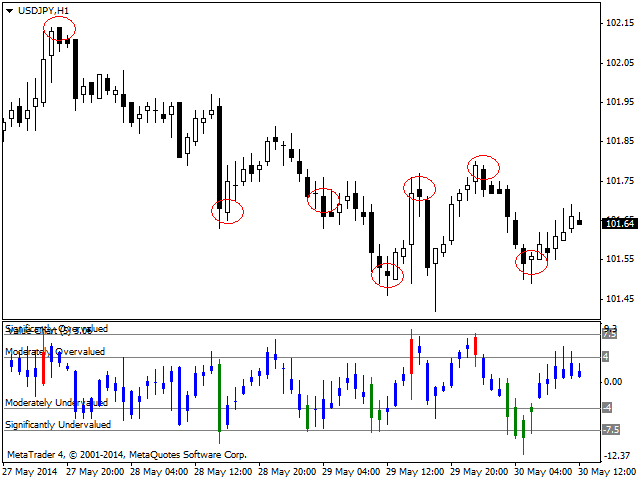
Value Chart for MT4
Value Charts (Helveg and Stendhal, 2002) - an innovative technology price display as a value, not the cost, even if the price volatility varies over time. It shows when a particular market is at an extremum and a high probability of reversal.
interpretation of values
Value Chart indicator determines the evaluation of the market, the price is displayed in one of five key assessment areas, which include:
- significantly overpriced
- moderately overpriced
- a fair assessment
- moderately undervalued
- significantly undervalued
When Value Chart indicator reaches a significant level, the bar changes color, indicating the possibility of opening a short or long position. Bar turns red when a financial instrument is significantly overvalued (the possibility of opening a short position) and green when it is significantly undervalued (the possibility of opening a long position).
An example of a trading strategy
As a rule, in bull markets fast, sharp pullback followed a slow upward movement diligent. As part of this strategy, we use the values of Value Chart to determine the temporary setbacks.
- Use the moving average to determine the overall trend.
- As soon as the moving average will determine the upward trend, expect the possibility of buying a value of Value Chart below -8.
- Close the position when the market is trading above the 8 indicator Value Chart.

Related posts
Hysteresis for MT4 This indicator determines the market regimes based on the channel moving average of the highs and lows. When the system is in a...
Golden section Track Golden section Track - MT4 indicator for the main chart window. The indicator is calculated in accordance with the moving average...
RightDirection Indicator RightDirection great tool and assistant to work with the trend. He performed well when paired with other indicators that signal...
Next posts
- Quantina Intelligence iTrend Indicator
- MurreyMath
- Trend Wave

No comments:
Post a Comment