Turning Point Detector MT4
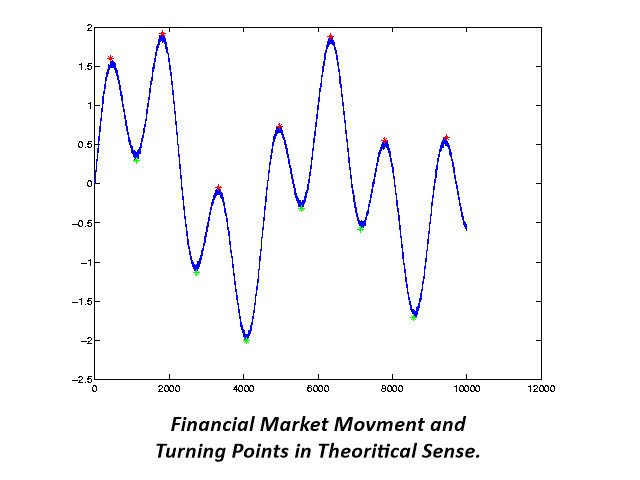
The trajectory of the financial market movements are similar to the polynomial Distortions of the presence of random fluctuations. There is a widespread belief that it is possible to spread the financial data on a variety of different cyclical components. If any financial market has at least one cycle, in these financial data should be turning point. In this case, most financial market data should have multiple pivot points as they usually consist of a plurality of cyclic components. Recognition of the turning points is extremely useful for traders and investors at any level, although it is a rather difficult task. We present to your attention a useful tool for the detection of turning points, if not "bullet-proof", but fairly accurate.
Description of the system
Indicator Turning Point Detector consists includes detecting anomalous movements system (main system) and market ranges recognition system (optional). Input parameters of abnormal motion detection system:
- TimeFrameCalculation - timeframe for the calculation of the abnormal movements.
- BarsToScan - the number of bars used for the calculation.
- DetectionMethod - method of operation of the system. Three methods are available.
- AnalyzingPeriod - the analysis period, the default 13. In most cases, the indicator works well with the default settings.
- MinDeviationInPips - minimum deviation in pips, the minimum distance at which the motion is considered to be abnormal. Typically, suitable value is one standard deviation of the currency pair.
To determine the range of the market, you can use Market Profile, Bollinger Bands or a similar tool. Input parameters Market Profile system:
- Use Market Profile - enable or disable the use of the system. To disable set the value to false.
- Session - Session: daily, weekly or monthly.
- Sessions To Count - the number of sessions used to calculate Market Profile
Indicator Bollinger bands (Bollinger) is standard supply terminal.
To create a market profile using Market Profile, select the corresponding timeframe:
- Daily Market Profile - a daily profile, you can use the time frame from M5 to H1. Recommended M30.
- Weekly Market Profile - weekly profile timeframe from the M30 to the H4. Recommended H1.
- Monthly Market Profile - a monthly profile timeframe H1 to D1. Recommended in the - H4.
Other input parameters:
- UseWhiteChart - set the white background, or use the default black, true or false.
- UseSoundAlert - audible warning
- UseEmailAlert - an email alert
- UseNotification - push-notifications
- BullishColor - color bullish signal
- BearishColor - color bearish signal
- LabelOffsetInPercent - shift tags timeframe (i.e., H1, H4, D1, etc.) as a percentage of the height of the chart.
- ArrowWidth - the thickness of the arrow indicating the direction.
- LineWidth - line width marker of abnormal motion (if is 0, the marker will be disabled).
- DrawRectangle - highlight rectangle abnormal movement.
- FillRectangle - fill color of the rectangle (true or false)
How to use
Universal Turning Point Detector indicator can be applied to any market data. You can use the default set minimum deviation in pips. You can also set your own value for the minimum deviation in points, for example equal to one standard deviation, or use other values. For example, 20 points (MinDeviationInPips) is well suited for major currency pairs on H1. Detection of abnormal movement is a sign of a reversal. However, it is recommended to use signals with the appearance of the arrow out of range. You can also use multiple instances of the display on the same graph with different timeframe. For example, you use Turning Point Detector TF H1 and D1 on the one chart. When using multiple timeframes need to use the appropriate timeframes in the Market Profile.
Note
We must understand that Turning Point Detector indicator is not "bullet-proof" a completely fault tolerant system. When used with the appropriate additional tools solutions, the system can become your favorite indicator of turning points, or used as part of a trading strategy. Before you buy be sure to test the strategy tester. Turning Point Detector indicator can be used alone or together with you any of the following trading systems:
- Harmonic Pattern Plus
- Harmonic Pattern Scenario Planner
- Price Breakout Pattern Scanner
- Pair Trading Station
- Mean Reversion Supply Demand

Related posts
MarketMeter It is easy to use for multiple timeframe indicator cluster analysis of these currencies. It provides a simple but at the same time effective...
Fibonacci Swing Scalp Fibonacci Swing Scalp (Fibonacci-SS) The indicator automatically sets Fibonacci line on the highs and lows of the visible part of...
HelpLine Introducing novelty in 2014 - nepererisovyvayuschiysya and easy to use HelpLine indicator for the Forex market . The indicator tracks trends,...

No comments:
Post a Comment