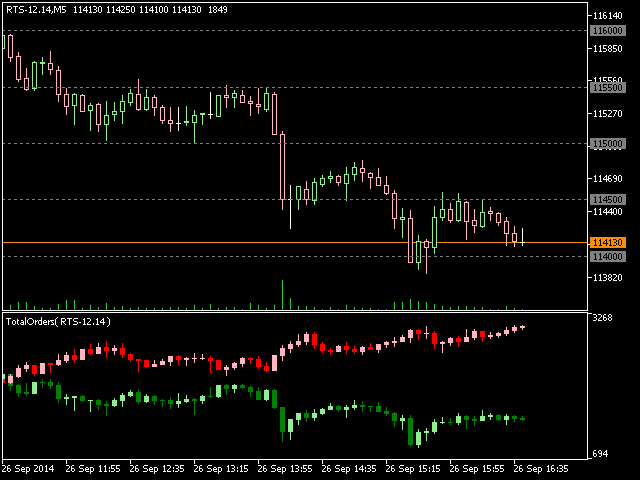
FORTS Total Orders
I bring to your attention the indicator showing the ratio of the number of orders of buyers / sellers for the Russian market FORTS futures. Now you can get this information in real time in the terminal MetaTrader 5. This will allow for development of new trading strategies or improve existing.
Data on the ratio of the number of orders are read from the database (CSV text or binary - user selectable). Thus, at the completion of shopping session and turn off the terminal (or the computer), and data is stored at the new start of the terminal - are loaded on a graph.
To maintain database on the ratio of orders you can use the utility FORTS All Saver or any other, save the data in the same format.
The ratio of the number of orders is displayed as two candlestick charts (buyers and sellers). The minimum possible timeframe - M1 (one minute). Thus, we can see a change in the ratio of orders inside the bar and its dynamics in comparison with the neighboring bars.
settings
Use CSV-file: Yes - the story is taken from a text file CSV-format; No - the story is taken from the binary file. Naturally, the file must exist in the terminal directory.
Use Common Directory: Yes - to use a common directory for all terminals to access the database history; No - each installed system MT5 terminal uses its own directory: "MQL5 \ Files \ TotalOrders".
File Name Prefix - prefix to form the file name. The file name is formed from the prefix sign of BUY / SELL, instrument name and extension. For example: "TotalOrdersBUY-GAZR-6.14.CSV". If the empty string is specified as the prefix, the prefix defaults to "TotalOrders".
History Show Period - the period of history that is displayed on the graph. It can be set from one day (trading day) of up to one year. It does not depend on the timeframe chart. Of course, the story needs to be physically present in the respective user's computer directory.
Chart Color Schema - color scheme indicator. Can be selected from the list - dark colors, light colors, alternate light colors, white on a black background and black on a white background.
Show Values on Chart - whether or not the current values Open / High / Low / Close in the indicator window in the form of numbers.
Proposal for interested users:
If you have ideas for improving this product or any of the other offered me, then write about them. In the case of realization of the idea, its author will receive a substantial discount on any of the products offered me.
Please write all the suggestions in the section "Discussion" section of this page - this will document the superiority and the idea of authorship.

Related posts
DeltaID5 R002 DeltaVolume Indicator inspired by the famous graphic MarketDelta. The indicator calculates the difference between the transactions...
Dynamic RSI Pointer MT5 Dynamic RSI Pointer designed Pointer Productions Pledge of effective work in the market - this is the best combination of...
Trajecta SpeedMap NZD What happens when you combine a trade market experience and intuition with the algorithm implemented in the form of visual maps? In...
Next posts
- JuiceEXT
- PZ Timeframe Overlay MT5
- Pan prizMA

No comments:
Post a Comment