Delta Pairs
Delta Pairs - The indicator for the pair trade, shows the difference of the two currency pairs. It is not redrawn. A useful tool for analyzing the behavior of the two currency pairs relative to each other.
appointment
Delta Pairs indicator designed to determine the differences in the movement of the two currency pairs. This indicator is displayed as two lines of the graph and the difference (delta) between the plotted as a histogram. Indicator Delta Pairs will be useful to those who use the pair trading. The basis of this method is used simultaneously by two trade financial instruments in this case currency pairs. The essence of this trade is to see the maximum divergence of the two currency pairs open the counter transaction, and when the currency pairs will come together to close the deal. The indicator does not guarantee the return of convergence of the currency pairs, the decision is yours.
Input parameters of the indicator
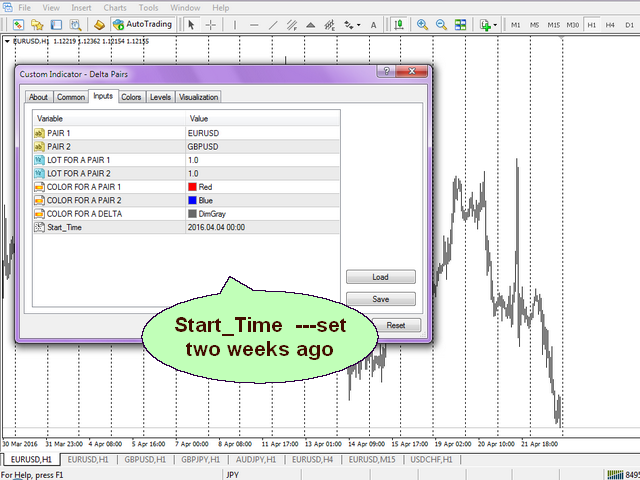
- PAIR 1- the pair number one (here you enter the first currency pair, it is important to specify exactly how your broker presents to the market review at the terminal, for example, EURUSD all capitals).
- PAIR 2- pair number two (here you enter the second currency pair, usually the currency pair which is composed of the same currency as the first pair, indicate also all capital letters, such as the second pair USDCHF).
- LOT FOR A PAIR 1- volume for the first pair (the default is one lot, and the line of this currency pair describe exactly the behavior of the graph itself currency pair).
- LOT FOR A PAIR 2- volume for the second pair (the default is one lot, and the line of this currency pair describe exactly the behavior of the graph itself currency pair. But it so happens that we need to display the graph of the mirror, that's when we write a lot equal to minus one, such as for the currency pair USDCHF).
- Start_Time -This option is the date of commencement of deviation between the reference currency pairs. Usually we use the date of the two-week period for the hourly chart.
application
- Set the indicator to the chart, in the pre-market review, specify those currency pairs you want to work.
- I recommend to use the chart period from 15M to 4H. Optimally 1H.
- Pick up the volume for currency pairs, it will provide a histogram of a different nature. The pictures show a variant downward trend channel option, the option of a triangle.
The advantages of LED
- It is not redrawn, that is, the histogram values are not changed over time, except for the zero bar.
- The histogram shows the discrepancy is not in points, and in the currency of the deposit, ie each bar of the histogram shows the sum of the two open positions, with the volumes that are indicated in the display settings.

Related posts
PipTick Pairs Cross MT5 Indicator PipTick Pairs Cross works with negatively correlated trade instruments such as the EURUSD and USDCHF. indicator is...
Verdure Correlation Pro introduction Correlation - a statistical measure of the relationship between the two financial instruments. This measure helps to...
Quantum Trend Volume Determine the current trend is one of the most important tasks of the trader, regardless of trading style. Indicator Quantum Trend...
Next posts
- Acc PriceBalance
- Verona Market Stream
- Geo Fractals

No comments:
Post a Comment