Trajecta Smart
Trajecta Smart - an innovative semi-automatic trading signals indicator for each pair and timeframe, which has a built-in system to determine the best and worst signal periods.
Work indicator is to render the best point in time for trading using the trend review panel and provide the trader the possibility of visual testing strategy on any pair and timeframe.
In addition, it is not necessary to configure anything - the indicator setting was made on the basis of the data analysis of the most profitable Trajecta Labs sets the parameters for signal algorithms. The indicator will search the signals to buy / sell and inform you about them using the alerts, customizable by the user.
With trade signals represented indicator merchants can determine the best pairs and timeframes and visually evaluate those or other trading signals.
Strategy
The basis of the indicator strategy is "smart" identification of lines of support and resistance, and the dynamics of price changes. It can be used on any time frame and a pair of selecting the best performance for more than 90%.
Trajecta VTP - Panel trends survey
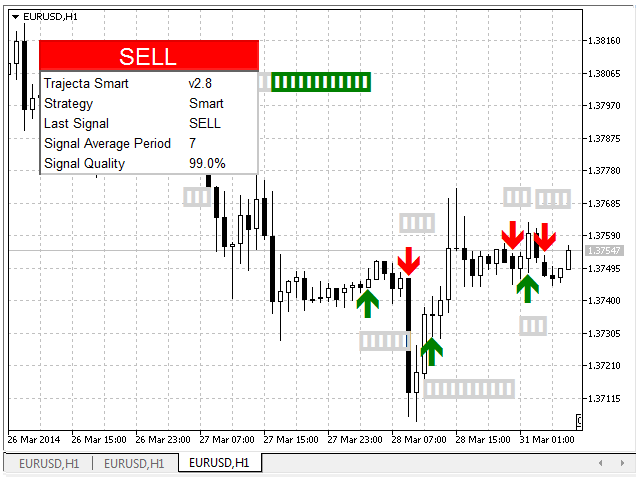
This is our first indicator that a trend view pane Trajecta VTP - innovative panel that facilitates decision-making by using the trading signals indicator. The panel laid algorithm for determining best and worst signal periods. The information is provided in real-time using the following notation:
- Grey Colour: probably a weak trend (usually at the beginning of the appearance of the signal)
- Green color: probably a strong trend (a good time to partially close a position)
- Blue colour: probably nearing the end of a strong trend
- Red color: probably a bad sign (be prepared to stop the trade)
Trajecta VIB - Visual Testing indicator
Exerting a lot of effort to create the possibility to visualize the testing of trading signals indicator, we have developed a visual testing technology indicators - Trajecta VIB.
Our innovative system will allow for multiple testing on any pair and time frame with a single click.
To do this, you need to maximize the scale of the graph and visually compare the number of bars of green / blue and red bars. The more bars, the green / blue color, the better.
Quality Control Panel
Quality control panel displays information about the last signal and its quality:
- version indicator
- Strategy
- The last signal (BUY or SELL)
- Average signal period (the average length of all signals)
- Signal quality (signal quality indicators in real-time)
alerts panel
You can activate alerts panel and receive messages when the signal changes of direction.
Step by step instructions on the use of
- Select a symbol for trade
- Select the period in which the sale will be conducted
- Wait to buy or sell signal (be patient when working on periods over M30).
- Align the Stop Loss and Take Profit.
- If trades efficiency below 90%, return to step 1 and a pair change period value or Stop Loss / Take Profit.

Related posts
Trajecta SpeedMap NZD What happens when you combine a trade market experience and intuition with the algorithm implemented in the form of visual maps? In...
PipTick Pairs Cross MT5 Indicator PipTick Pairs Cross works with negatively correlated trade instruments such as the EURUSD and USDCHF. indicator is...
Herrick Payoff Index payment index Herrick (Herrick Payoff Index, HPI) confirms the strong trends and helps determine when they change its direction;...
Next posts
- Rubber tape
- Levels MQL MT5
- Synthetic

No comments:
Post a Comment