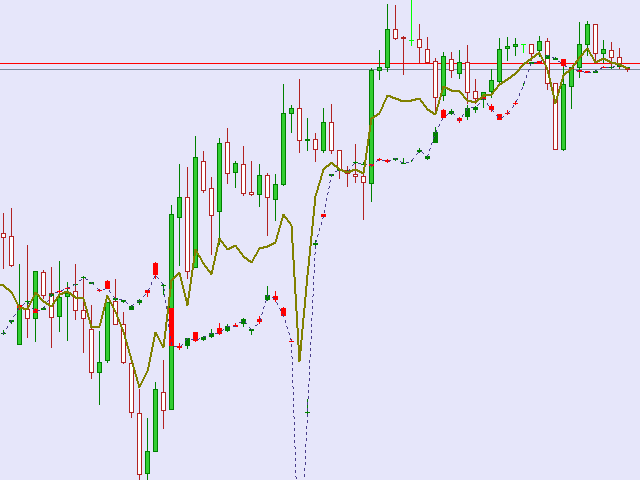
Virtual Level of Market Prices
The indicator is based on a new theory of the market, advanced, reasonable and discussed in a branch of the same name on the forum https://www.mql5.com/ru/forum/58256
New market theory is based on the principles of receiving or not receiving profits. It is equally aptly describes as a real market for goods and services, and the Forex market. If the real market it allows to identify the conditions for obtaining the maximum profit, then the Forex market, the same theory, without any change of concepts and levels, allowing to enter the break-even trading conditions, and in practice it is confirmed.
According to this theory, the market prices are four levels.
Along with the current price of C (Bulls or Bears), we observe on the terminal actually exist virtual market price P (bears or bulls) that are closely related to the current price of D and by the will of the optimal Tsopt (Leo) and average market Rp (Leopard ) prices are mutually transformed into each other, so to speak.
The indicator allows you to see the beginning of the formation of trends, moments of transition into a flat and vice versa - in the trend of the specific behavior of the virtual level of market prices.
Work on these principles indicator clearly visible in the above video. In fact, the market candle periodically disappear and are formed again due to a complete recalculation of the indicator, for example, when upload historical data terminal.
The indicator allows you to see the true battles and current market levels prices, reaching into the depths of the market, which until now were invisible to researchers markets and traders. I hope that the use of the indicator allows traders to conduct successful trading in any time frames, especially on the M1.
Good luck to all trade with the indicator, which is an X-ray, highlights the state of the market.
Options
- Calculation period - calculation period;
- The width of the Bull Candle body - body width bullish candle;
- Colour of the Bull Candle body - the color of the Bull Candle body;
- Colour of shadovs bullish candle - color shadows bullish candle;
- The width of the Bear Candle body - body width bearish candle;
- Colour of the Bear Candle body - body color bearish candle;
- Colour of shadovs bearish candle - shadow color of bearish candles.

Video
Related posts
Level Moving Averages Message Indicator Level Moving Averages Message (see the description, video) does not paint a very moving average line in the chart...
DreamCatcher The indicator shows a favorable entry points into the market by the arrows. Can be used for pipsing on small periods, and for the long-term...
NewBbandsMT4 Probably every trader known indicator Bollinger Bands (Bollinger Bands). This indicator is similar to moving average envelopes, but based on...
Next posts
- Daily Breakouts
- CurrencyRSI
- Trend Navigator

No comments:
Post a Comment