Tick Volume Histogram Indicator
Indicator Tick Volume Histogram is drawn in a separate graphic window.
It displays the number of ticks on the histogram peak, drawn in a separate window.
Equipped with a bar graph display feature a variety of ways:
- If Plot Line and Show Volume are false, the bar with lots of ticks displayed as large histogram, and a bar with fewer ticks displayed as a smaller bar graph.
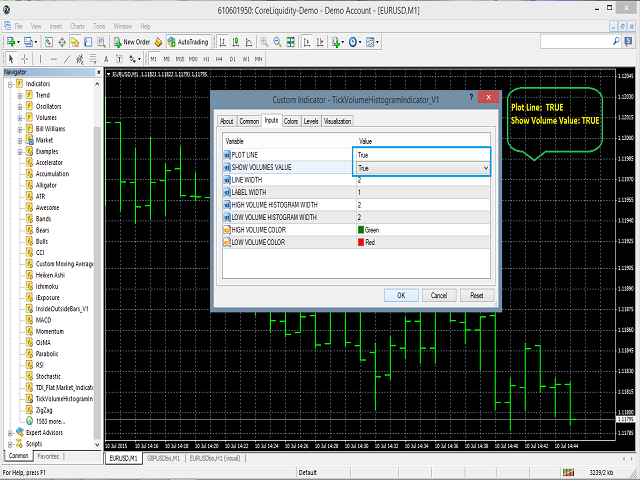
- If Plot Line is set to true, and the Show Volume is false, the line is drawn, which unites the peaks of the histogram.
- If Plot Line and Show Volume are true, then together with the connecting line of the peaks of the histogram shows the number of ticks on the histogram peak.
Indicator Tick Volume Histogram enables you to customize the color and width of the histogram.
It also allows you to adjust the width of the number of ticks to be displayed on the histogram peak.

Related posts
Auto ZZ SR Indicator This indicator automatically draws the trend lines on the upper and lower points of extremum using the ZigZag indicator . As an...
Harmonic Trading Pro Indicator
Harmonic Trading Pro Indicator Harmonic Trading Pro Indicator is unlike any other one harmonic light in the market . This harmonic light has a very...
Bollinger Histogram Histogram of the difference of the upper and lower level lines Bollinger. Height Histogram range extension means for trending portion...
Next posts
- Virtual Level of Market Prices
- Daily Breakouts
- CurrencyRSI

No comments:
Post a Comment