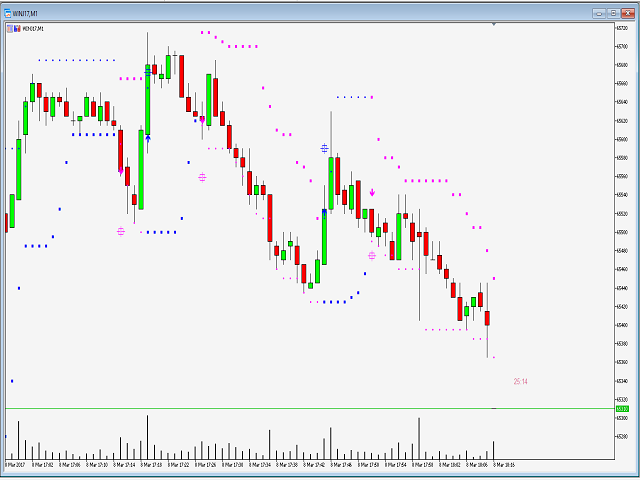
TradeLeader Indicator
Signal indicator, based on the volatility of the asset. It tracks the volume levels of volatility and market movements with the help of the indicator ATR (Average True Range).
TradeLeader clearly shows the time to buy if the sale by asking the support and resistance levels, calculated indicators of WPR (Williams Percent Range) and NRTR (Nick Rypock Trailing Reverse).
Thus, you can easily set a stop-loss and take-profit (if they are used in your trade), noting the support and resistance on the chart.
candle scale It helps you enter the market at the right moment, evaluating the dynamics of the moment.
It works on any assets, currencies, time frames, the Forex or BMF / Bovespa.
adjustment
Additional calibration is not required, simply enter the calculation of the risk of using the ratio of the take-profit and stop-loss. If desired, you can change the indicator settings.
- Rate takeprofit x stoploss: the ratio of the take-profit to the stop-loss, the default 0.7, which is 30% of the risk to profits. If you specify a value of 1.0, take profit is the same as the stop-loss, or 50%.
- WPR period: the period of WPR, default 12.
- WPR upper: maximum WPR, default -38. The maximum value of the previous n periods. The values range from 0% to 20% indicate that the market is overbought.
- WPR lower: at least WPR, default -62. The minimum value for the previous n periods. Values ranging from 80 to 100% indicate that the market is oversold.
- In parameters upper and lower minus sign in the calculation is omitted, but is included in the values of parameters as indicated above.
- ATR period: the period of the ATR, the default of 120.
signals
- Buy when receiving a signal for purchase (arrow). Take-profit is celebrated icon sight, is calculated using the risk calculation. However, if you wish, you can continue to keep the deal on the resistance indicator.
- Sell when receiving a signal for sale (down arrow). Take-profit is celebrated icon sight, as calculated using the risk calculation. Similarly, if you wish, you can continue to keep the deal on the indicator support.
This can be very helpful for beginners who are not familiar with the indicators and graphs.
Advice
- Volatility in the market, for example, during the news may affect the operation of the indicator that is to be expected. Remember that in case of news or for the protection position by turning the stop-loss is not commonly used.
- In low volume periods it may happen that due to its lack of intended targets can not be achieved. Some strategies may be advantageous to use bezubytka and trailing stop.
- For scalping, use a smaller timeframe.
- In normal market conditions, wait for the next candle after the signal to confirm the move.
- You can use the Bollinger band as a reference point for both the partial realization, and to confirm the level of take-profit or other preferred indicator.
Remember: no one indicator is not 100% wins. Always use common sense.

Related posts
Bulls and Bears indicator Bulls and Bears Indicator An indicator showing who is dominant at the moment on the market : buyers (Bulls-bulls) or sellers...
New Trade MT5 This is a simple, easy-to-use and effective indicator . This strategy is suitable for all traders, even for beginners. Input parameters are...
Indicator Combine Merge by Runwis
Indicator Combine Merge by RunwiseFX It allows you to combine multiple indicators in one both visually and in alerts. These can be standard indicators...

No comments:
Post a Comment