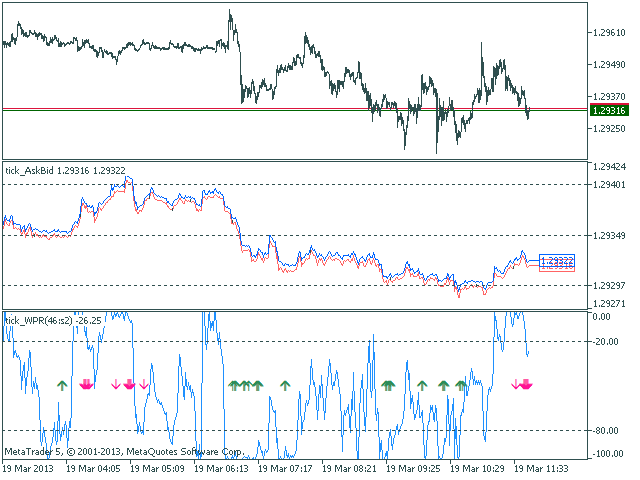
Tiks WPR 4
Indicator Percentage Range of Williams (Williams' Percent Range,% R), built on tick price chart. When you run the parish, you must wait for calculating an amount of tick data.
Options:
- WPR Period - indicator period.
- Overbuying level - overbought level.
- overselling level - oversold level.
- price mode - the price range of a calculation (can be bid, ask or average)
- Salculated bar - the number of bars in the chart to calculate the indicator.
Followed parameters governing weight WPR oscillator signal (0 to 100). Their description can be found in the MQL5 Reference section of the oscillator signals Williams Percent Range.
- The oscillator has required direction - reversal of the oscillator.
- Reverse behind the level of overbuying / overselling - reversal of the level of overbought / oversold.
- Divergence of the oscillator and price - divergence.
buffers room: 0 - WPR, 1 - SIGNAL_UP, 2 - SIGNAL_DOWN.

Related posts
NearLevels LED displays random fractals and support / resistance levels constructed from them. Using an indicator you see a clearer picture of the market...
Moving Average fullshift Moving average , which can be shifted not only to the right / to the left, but also up / down. It is also possible to select the...
MA Statistics The indicator calculates certain statistical data relating to the moving average (MA) and price . Statistics associated with points...

No comments:
Post a Comment