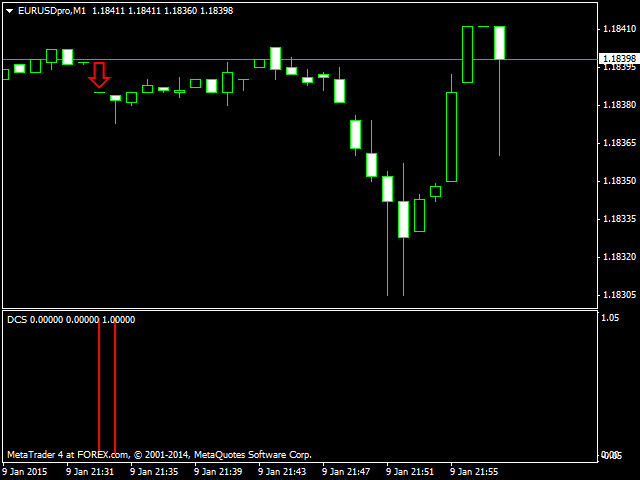
DCS
Indicator as a histogram.
The basis of the indicator - a few matches with the signals of other standard indicators, namely: DMI, Stochastic and CCI.
When all three indicators give the same signal, then the DCS indicator gives us signals:
Red histogram - a sell signal
Green histogram - a buy signal
The default settings of the indicator:
DMI_Period = 14;
CCI_Period = 14;
Stochastic_K = 5;
Stochastic_SD = 3;
Stochastic_D = 3;
Stochastic_OB = 80;
Stochastic_OS = 20;
In addition to these three indicators, the code is registered as special filter signals.

Related posts
AO AC Signal Indicator in the form of dots on the chart shows the zero crossing indicator level selected in the parameters. AO, AC or AO + AC signals if...
Simple Trade technical indicator Simple Trade , developed by a group of traders for your convenience. The indicator is calculated on a fairly complex...
MarketMeter It is easy to use for multiple timeframe indicator cluster analysis of these currencies. It provides a simple but at the same time effective...

No comments:
Post a Comment