VolumeDeltaMT5
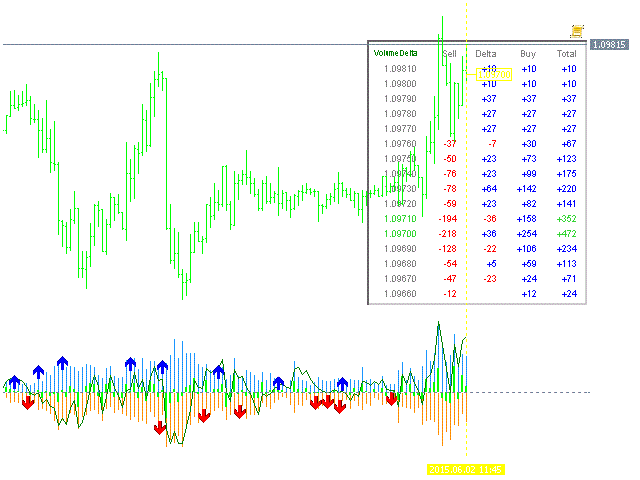
This indicator allows you to analyze the delta tick volume. It calculates each bar tick volume of purchases and sales (separately), as well as their difference. In addition, it displays the volumes broken down by clusters (cells) within a specified price bar (usually the last bar).
It is limited in its capabilities replacement market analysis of the delta, which has traditionally been based on actual volumes, but they are not available in the Forex market.
LED displays graphs of the following data in its pane:
- light blue histogram - volume purchases;
- Orange histogram - sales;
- light green histogram - the difference between buying and selling;
- Green Line - the cumulative delta smoothed EMA of the difference; it increased CumulativePeriod time to maintain approximately equal scale histograms;
- blue and red arrows - mark those bars, in which the direction counter to the direction of the delta volume prices that may serve as a signal.
indicator also displays a table in the main window of the split volumes for the current bar. The current bar is selected using the yellow dotted vertical line (drag it to the desired location). The table rows correspond to clusters prices. The table contains the following columns:
- price (range from the specified value until the next top);
- volume of sales;
- delta between purchases and sales (positive - blue, negative - red);
- the volume of purchases;
- total (with values near maximum cell lit in green).
Options
- PointsPerCell - number of items in a single cluster prices; each cluster appears as a separate line in the table split the volume of the current bar (this is a kind of analogue tape "Time and Sales"); Default - 10;
- LastBars - the number of bars for the calculation; default - 1000; 0 means all the bars;
- CumulativePeriod - period calculating cumulative delta, EMA; Default - 12;
- StickToBar0 - on / off mode when the yellow dotted vertical line is "glued" to the last bar, that is, it always remains current; default - false;
- Corner - corner of the main window, where the table will be displayed; default - the top right;
- CellWidth - width table cells; Default - 40;
- CellHeight - height of table cells; Default - 15;
- ColorBG - background color of the table; default - Black;
- FontSize - font size table; default - 7;
- HideTable - If true, the table with the volume is not displayed; default - true;
- HideMark - if true, the price tag on the level of the maximum volume is not displayed; default - true; when both parameters HideTable and HideMark is true, the vertical line for the selection of the test bars are not output;
- HideBuySell - option, which allows to hide output column volumes Buy and Sell in the table, and respective histograms (default is false);
- UseRealVolumes - It allows you to enable payments for the real mode volume, placing it in the true (default false).
Acceptable timeframes: M5 and above.
After the initial placement of the indicator on the graph may need some time to download the data from the timeframe M1, and lines may not be displayed fully. Wait for automatic recalculation of the indicator.

Related posts
Elder AutoEnvelope Envelopes (Envelopes) or channel lines are similar to moving averages (or slow MA with two MA). Inside the channel lines daily...
Herrick Payoff Index payment index Herrick (Herrick Payoff Index, HPI) confirms the strong trends and helps determine when they change its direction;...
Bulls and Bears indicator Bulls and Bears Indicator An indicator showing who is dominant at the moment on the market : buyers (Bulls-bulls) or sellers...

No comments:
Post a Comment