Corporate Report MT5
Program (script) displays information on the monitor of the corporate
action reports; Information downloaded from the site
https://ru.investing.com/earnings-calendar/:
- Date of the report
- Earnings per share (EPS)
- Income (Revenue)
- market capitalization
The program works on the following principle:
- Seeking information on the ticker, on which it is running (the same
It works with "#ticker" "ticker" instruments). If the data is not found,
It offers to find the number in the list the Ticker List and manually enter the number
once out of the window at the bottom left with the note number. If you want to change
previously selected number, then the question of whether this is the company you need to press and no
enter the new number. This is necessary when your broker has signed a ticker on the,
e.g. _Sberbank_adr * instead of the usual SBER (manually enter ticker
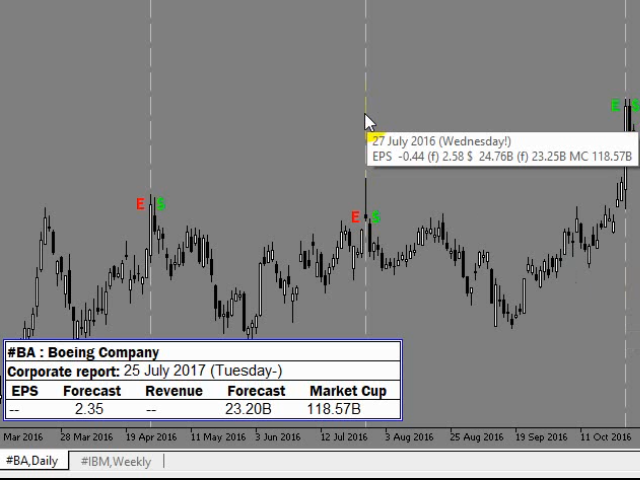
only in the full version). - It creates a vertical line on the graph that match
dates published corporate reports. Tooltip
each line contains information about the corporate report. - Near the vertical lines on the graph plotted mark "E","$":
- If earnings per share (EPS) more than the forecast, then put the mark "E" Green colour,
- if you do not live up to expectations, then red;
- if the record income (Revenue) exceeds the forecast, then put the mark "$" Green colour,
- if you do not live up to expectations, then red.
- At the bottom left in the table shows: ticker (the one on which was
the program is running) and the name of the company (equivalent to that
downloaded from the site),
the date and information about the report, which is expected to be published or not more than 5 days ago.
(by
After 5 days after the publication of the report it is moved on the graph in
a vertical line and begins searching for the next date of the report.) - tagging "+""-""!"In the date of the report point to the time of the publication of the report in the following way:
- Publication of the report:
- - Before the market opened,
- + After the market close,
- ! Prior to the opening of the market on or after the closing of the market, there is no information about this.
- To understand the performance of the company to monitor trends
displays graphs of indicators: earnings per share (EPS), income (Revenue
$). The graphs of these figures are based on the reports and downloadable
data that is in the downloaded reports. If your site is not
some of the reports, the chart will be built on the basis of those reports,
that is. If you download the report is not the appropriate indicator in the
chart, this value will be zero. These graphs can be moved or
remove. The graphic does not get a report, which is in the left table
at the bottom, just get the ones that are displayed on horizontal lines
chart. - If the program is added to the charting tool with which it is not
work (which is not on the list), then no action is not performed
will be. If this schedule to save a report from another company, it
It will be deleted. - The program works in Russian and English languages.
list of tools (Shares, stock, CFD, ADR), It works with the program: numbers 18054 Ticker; The list shows tickers 80 countries;
The "discussion" of the countries and attached file the Ticker List, which lists all of the tools with which the program works.
Before you can use:
- You need to add URL https://ru.investing.com/earnings-calendar/Service/getCalendarFilteredData the list of allowed URL. "Settings" -> "Expert Advisors" -> "Allow WebRequest for the following URL".
- For convenience, you can assign a script to a hot key: in
tab of the "Navigator", right click on "Corporate Report"
-> "Set hotkey" -> and to choose a suitable for yourself
combination.
Note:
- For a more comfortable use of the monitor is recommended vertical resolution of 900 or more.
- The program and all used the information it depends on the site
investing.com and work, while you can get the entire program-
this information at this link
https://ru.investing.com/earnings-calendar/Service/getCalendarFilteredData.
It can not be tested in the tester (since there is no way to get
information from the Internet). For a complete overview functionality has
demo (https://www.mql5.com/ru/market/product/23718).

Video
Related posts
Qautoactivation Indicator qAutoActivation - one of the main components of the trade expert panel Trading Chaos Expert. The indicator visually shows on...
CSV economic news calendar auto
CSV economic news calendar auto converter MT5 Many advisors and indicators using data from the economic calendar dailyfx site. com in CSV format. But...
Fast Switching Symbols Periods
Fast Switching Symbols Periods MT5 The indicator allows to quickly switch from one instrument to another, from one time period to another. This will help...
Next posts
- Dashboard Currency Strength Advanced
- Exp Assistant 5
- Trail Stops by Custom Indicator

No comments:
Post a Comment