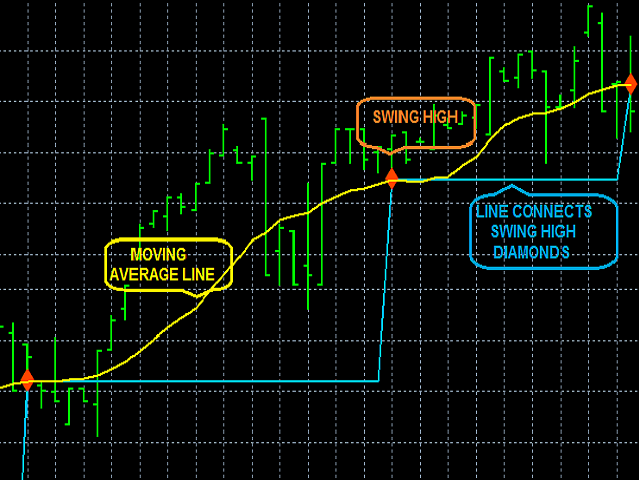
MA Swing High Single Time Frame Indicator
MA Swing High Single Time Frame Indicator - advanced LED-based Swing High and MA trading strategies.
Features
- Displays the calculated values and the schedule of MA Swing High Swing High values on all timeframes.
- Specify the scan settings for ideal conditions for the formation of the bar to calculate the Swing High.
- Set the number of bars before the current bar to verify the criteria of an ideal bar.
- Set the number of bars after the current bar to verify the criteria of an ideal bar.
- See schedule MA at different timeframes with the calculated values MA Swing High.
- See Swing Low points on the graph, or with values.
- Change the color of text blocks and graphics lines.
Input parameters
- APPLIED_PRICE: price type (Close Price, Open Price, High Price, Low Price, Median Price, Typical Price, Weighted Price).
- MA_METHOD: method MA (Simple, Exponential, Smoothed and Linear Weighted).
- MA_PERIOD: choose the period MA.
- LEFT_BAR_PERFECT: check the conditions for the formation of an ideal bar to the left of the current bar.
- LEFT_BAR_NUMBER: how many bars before the current should be checked. Enable this option if you have included the previous one.
- RIGHT_BAR_PERFECT: check the conditions for the formation of an ideal bar to the right of the current bar.
- RIGHT_BAR_NUMBER: how many bars should be checked after the current. Enable this option if you have included the previous one.
- PLOT_LINE: enable / disable the Swing High reliance on graphics.
- LINE_WIDTH: width Swing High Line.
- LINE COLOR: color Swing High Line.
- MA_ARROW_SIZE: Swing High resolution pixels.
- ARROW COLOR: color Swing High point.
- MA_LINE: show / hide the MA line on the graph.
- MA_LINE_WIDTH: width MA line.
- MA_LINE_COLOR: color line MA.

Related posts
Fibonacci Swing Scalp Fibonacci Swing Scalp (Fibonacci-SS) The indicator automatically sets Fibonacci line on the highs and lows of the visible part of...
Vola Alarm Free Vola Alarm shows the current value of the price movement since the opening of the bar at a percentage of the average price movement ....
MacdPlus Indicator Moving Average Convergence Divergence (or MACD) - This trendsledyaschy momentum indicator showing the relationship between two moving...
Next posts
- Analyzer PRO
- Sensh RD
- Trade On Test

No comments:
Post a Comment