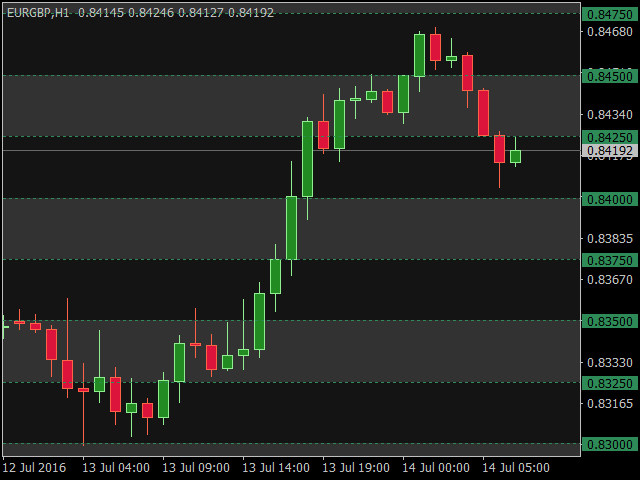
Fringes
Indicator draws horizontal stripes in the background graphics with high pips specified in the parameters. Very useful for a visual highlight certain price levels, for example, round numbers.
You can choose to automatically rendering strips from minimum to maximum schedule, or select a drawing a certain number of bands above and / or below the selected price.
You can also select the drawing dividing lines between all stripes. You can customize the colors. line type and height in pips for each band.
Description of the input parameters
- Automatic Price: if true, the indicator draws a horizontal strip along the entire schedule. When false, the number of lanes is drawn only indicated in Steps parameter above and / or below the price is selected in Initial Price parameter.
- Initial Price: price, which will be drawn from the band (only with Automatic Price = false).
- Steps: the number of bands that are drawn on each side (only Automatic Price = false).
- Draw Up: draw band higher than the price indicated in the Initial Price parameter (only for Automatic Price = false).
- Draw Down: draw bands below the price specified in the parameter Initial Price (only when Automatic Price = false).
- Distance (in pips): height bands in pips
- Fringe 1 Color: the first color stripes.
- Fringe 2 Color: second color adjacent strips.
- Draw Separator Lines: draw a horizontal line between the bands.
- Lines Color: color dividing lines.
- Lines Style: style dividing lines.
- Lines Width: the thickness of the dividing lines.
- Show Chart Grid: show / hide the grid graph (true / false).
- Show Period Separators: show / hide period separators (true / false).
Author: Jose Francisco Casado Fernandez (Robertomar) Email: robertoma@ono.com

Related posts
CurrencyRSI This indicator calculates the Relative Strength Index (Relative Strength Index) in the indices AUD, CAD, EUR, GBP, JPY, NZD, USD in a single...
MacdPlus Indicator Moving Average Convergence Divergence (or MACD) - This trendsledyaschy momentum indicator showing the relationship between two moving...
MarketMeter It is easy to use for multiple timeframe indicator cluster analysis of these currencies. It provides a simple but at the same time effective...
Next posts
- Trending Bands
- MichaelWave
- GJPivots

No comments:
Post a Comment