SOMFX1Builder
If you are trading using candlestick shapes and want to improve their methods of modern technology, this script is for you. In fact, it is part of a set of tools, which is based on neural network engine SOM (Self-Organizing Map, SOM) for the detection and prediction of candle shapes, as well as for the study of input data and results of operation of the network. The kit contains:
- SOMFX1Builder - the script for the training of neural networks; it creates a file with the generalized data of the most characteristic price figures, which can be used to predict the bars in the figures or in a separate window (via SOMFX1 indicator) or directly on the main graph (SOMFX1Predictor);
- SOMFX1 - an indicator for the prediction and visual analysis of price figures, the input and output of the trained neural network (in a separate window);
- SOMFX1Predictor - another indicator to predict price patterns directly in the main window;
Tools implemented separately from each other due to the fact that MetaTrader 4 has some limitations, e.g., at the moment it is impossible to run lengthy calculations in the indicator, since LEDs are executed in the main stream.
In short, the whole process of price analysis, network training, recognition of figures and their predictions are lies in the following steps:
- Creating a neural network using SOMFX1Builder;
- Analysis of the quality of the received network via SOMFX1; If unsatisfactory, return to step 1 to the new settings; you can skip step 2 if desired;
- Using the final version of the network to predict the shapes using SOMFX1Predictor.
Step 1 discussed in detail below. More information on the visual analysis and prediction - in the pages of the relevant indicators.
Warning: This script does not predict the figure. He trains a neural network and stores them in a file to be loaded into the indicators SOMFX1 or SOMFX1Predictor. Thus, it is necessary to acquire one or both of the indicator in addition to the script.
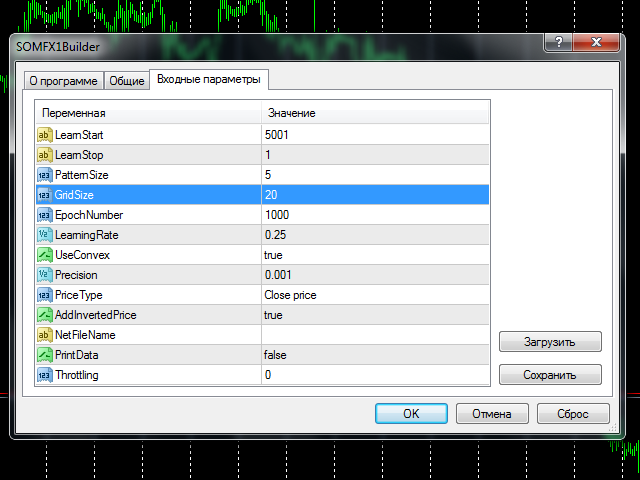
To start training, select the range of bars in history (parameters LearnStart and LearnStop), The number of bars in a single figure (PatternSize), Card size (GridSize), The number of training cycles (EpochNumber). Other parameters can also affect the process, but details of them will be presented below in the "Settings" section.
Education may take considerable time, depending on the parameters. The more bars in the area of training, the longer the process. The size of the figures, the size of the map and the number of cycles affect similarly. For example, training on the 5000 map of bars of size 10 * 10 It may take a few minutes on average PC. All this time, the load on the CPU core to the maximum, and the terminal may slow down if the processor does not have a free kernel. For training, choose a time when you are not going to trade actively, for example, over the weekend. This is especially important as the learning process may require repeating in order to optimize results. Why this is so described below in "Selecting the optimal settings" section.
Before you start reading the following sections, it makes sense to get acquainted with the section "Principles of Operation" on page SOMFX1 which provides an overview of the neural network used.
Options
- LearnStart - bar number in the history of where to start training data, or the exact date and time of the bar (in the format "YYYY.MM.DD HH: MM"); This parameter - a string that allows you to type and number, and the date; it is important that the number of bars change constantly as new, so a value of 1000, introduced yesterday, today will most likely correspond to another bar (except in the case of weekly bars); during the training process, it does not matter, because all training data are collected before starting the training and do not change afterwards; ; 5001 - default
- LearnStop - bar number in history, where the training data ends, or the exact date and time of the bar (in the format "YYYY.MM.DD HH: MM"); This parameter - a string; value LearnStart must be over LearnStop; difference between LearnStart and LearnStop - number of input vectors (samples) applied to the input of the neural network (more exactly, it LearnStart-LearnStop-PatternSize); default - 1 (the latter usually unfinished bar excluded);
- PatternSize - the number of bars in the same figure; is the length of the input vector (sample price movements); after learning the first PatternSize-1 bars will be used for the prediction of the last sample of the bar; for example, if PatternSize - 5, 5 bars are extracted from samples and price stream used during training, and then 4 bars allow to evaluate initial segments at each time is 5 minutes bar; allowable value: 3 - 10; default - 5;
- GridSize - card size; is the number of cells / neurons vertically and horizontally; the total number of neurons equal GridSize * GridSize (2D-map); permissible values: 3 - 50, but be careful: a value greater than 20 mean quite a long training with a heavy load on the CPU; default - 7 (applicable for the first test, to get acquainted with the tools, but is likely to require an increase to real-world problems);
- EpochNumber - the number of training cycles; default - 1000; Training can be completed earlier if the error threshold reached Precision; in each cycle, all input samples are fed to the neural network;
- LearningRate - the initial rate of learning; default - 0.25; by trial and error, you should pick up a value in the range of 0.1 - 0.5;
- UseConvex - enabling / disabling convex combination of the method for initialization of the input vector during the first cycles; method involves incorporation better separation samples; default - true;
- Precision - floating-point number, sets the threshold stop instruction when the total error of the neural network is changed is smaller than the specified value; ; 0.001 - default
- PriceType - type of prices for the samples; default - close;
- AddInvertedPrice - on / off mode, when the set of samples are added to the inverted price movements; it can help to eliminate the offset of neural network estimates due to the trend; default - true; this means that the number of samples will be doubled: (LearnStart-LearnStop-PatternSize) * 2;
- NetFileName - file name to save the final neural network; default - empty - in this case will be automatically constructed a special name with the following structure: SOM-V-D-SYMBOL-TF-YYYYMMDDHHMM-YYYYMMDDHHMM-P.candlemap, where the V - PatternSize, D - GridSize, SYMBOL - the current symbol, TF - the current timeframe, YYYYMMDDHHMM - LearnStart and LearnStop respectively; even LearnStart and LearnStop defined as the number, they are automatically transferred to the date and time; P - PriceType; It recommended to leave this option blank, because the auto-generated name and recognized indicators SOMFX1 SOMFX1Predictor and extracted from it all settings so that you do not have to manually enter all the settings one by one; Otherwise, if the user is given its file name, all the settings used for training should be exactly duplicated in the dialogues and SOMFX1 SOMFX1Predictor, and it is important to adjust or convert LearnStart and LearnStop the date / time, because the numbers are not the bars;
- PrintData - enable / disable the output of debugging messages in the log; default - false;
- Throttling - the number of milliseconds to pause instruction per cycle; This reduces the CPU load by increasing the training time; This can be useful if a PC is not powerful enough, and training should not interfere with other interactive tasks; Default - 0.
Choosing the optimal parameters
The most important questions that must be answered before you start training the neural network, it is:
- How many bars to apply for the network input?
- How to choose the sample / figure size?
- How to choose the size of the network?
They are all interconnected, and a decision on one of them influences the other.
Increasing the depth of history, which produced data selection for training, can be expected to improve the generalization ability of the network. This means that each figure is confirmed revealed a large number of samples, whereby the network finds patterns in prices, and not random features. On the other hand, to feed too many samples at the same network size, the network could lead to the effect that the network generalizes ability degrades in the averaging, and the various figures will be mixed in the same neuron. This occurs because the neural network has a limited "memory", which depends primarily on its size. The larger, the more samples can be processed. Unfortunately, there is no exact formula for this calculation. About the rule is:
D = sqrt (5 * sqrt (N))
where N - number of samples, and D - the network size (GridSize).
Thus, it is possible to select the first number of bars for training, guided by their preferred trading strategies. Then, with this number, you can calculate the required size of the network. For example, for the timeframe H1, 5760 bars - this year, which is probably a good horizon when trading on H1, then you can try the default value of 5000. Of this magnitude is easily obtained from the formula the size of ~ 20. It is important to note that the parameter setting AddInvertedPrice to true will increase the number of samples by 2 times, and then the size of the network need to be increased accordingly. If, after training the neural network gives too many mistakes (which can be checked using SOMFX1 or SOMFX1Predictor), you must either increase the size of the network, or to reduce the number of training data. Parameter PriceType may also be important (see. below). In any case, if you from personal experience know that a certain figure occurs on average at least 10 times is not a certain period of time, you can consider this period sufficient for training, as 10 samples should be sufficient for the compilation and release in the figure. Use SOMFX1 to study how samples fell into each neuron and how evenly distributed samples of neurons.
You can consider the matter from the other side. The number of neurons in the network - this is the maximum number of price patterns. If we assume that only 50 known figures, the size of the network can be about 7. The problem here is that it is impossible to "tell" the network that we want it to learn these specific shapes and paid attention to the other: the neural network will be trained on all samples and find all the pieces of the price series. Thus, 50 famous figures constitute only a part of all the pieces that the network will attempt to learn. What is this part - again, an open question. That is why it is usually necessary to start training a few times with different settings and look for a better configuration.
In the case of classical candlestick figures, most built of 3-4-5 bars. For neural networks 3 or 4 bar may be sufficient size for proper separation figures. recommended set PatternSize equal to 5 or more. Increasing the size of the image increases the computational load.
PriceType in conventional candle equivalent figures close. The neural network can recognize shapes formed on any type of prices, such as typical, high or low. This is particularly important because a number of prices close usually very uneven, that "there is" additional costs "memory" of the network. In other words - training close much more difficult than training typical, and it requires a larger size of the network, with an equal set of input bars. Thus, the use typical instead close can help reduce the size of the network or to increase the accuracy.
Procedure
After setting the parameters and clicking the OK button starts the learning process. During the process, the script displays the current number of the cycle, error, learning rate and the percentage of readiness comment (at the top left corner of the window). The same information is displayed in the log. When complete, a message (alert), containing the generated file name of the network. The file is saved in the working directory Files MQL4. If this is automatically generated name (NetFileName was empty), you can copy it directly from the message window or in SOMFX1 SOMFX1Predict (there should be inserted the name in the same setting NetFileName) And run the neural network. If you use your own file name, you must copy all the parameters in the indicators - in addition to the file name is the area of training, the network size, the size of the figures, etc.
It is important to note that the neural network file does not contain the input data - it is only the trained network. The next time a network is loaded into the display, reads the parameters and produces on the basis of their samples at random from the quotes again.
Before each start of the learning process, the weight of the network of neurons are randomly initialized. Therefore, each script with the same settings, creates a new map, different from the previous one.
Recommended timeframes: H1 and older.

Related posts
TCS Trade Panel
TCS Trade Panel Panel for quick and convenient operation using the basic functions of the opening and closing of orders by type, as well as the functions...
Dashboard DIBS Method
Dashboard The DIBS Method DIBS = Daily Inside Bar Setup (daily inside bar) For signal generation system uses the popular candlestick pattern "inside bar"...
Binary Option Gym MT4 Free
Binary Option Gym MT4 Free Explore free version of Binary Option Gym. Note: This free version has some limitations on settings change Expiry time :...
Next posts
- Fast Trade Copier Demo
- Assistant Scalper Demo
- Strongest Levels Global Demo


