Monday, July 31, 2017

TRADER dies for metal Four simple

TRADER dies for the metal? Four simple criterion for the selection of profitable signals.

Probably the most
the famous line from Gounod's "Faust" sounds in the aria Mephistopheles "People are dying
for the metal. " In the previous article, sharing some of my observations on
subscriptions to trading signals via MT4 and MT5 platforms (remember? tab
"Signals" at the bottom of the terminal), I suggested that subscribers often choose
signal solely on its profitability, completely forgetting about the risks.


So what is next? Really
what follows is what he sang Mephistopheles?


To be
fair, of course, everything is not so tragic. First, the signal for selecting
themselves, can be guided not only by the popularity rating among
subscribers, but also to the rating that offers mql5.com portal itself. this rating
based on more than three dozen indicators, although the formula for calculating it
the creators of the secretive and hidden behind seven locks, which naturally causes
displeasure of certain skeptics, who do not want to trust someone's word, and
willing to just dig themselves.


Well, him and all the cards in
hands - individually all three dozen parameters of each signal
available to anyone, and in the online mode. Want - to make his formula, and you want
- just studied and analyzed, and signs.


Personally, I do not ship
himself all this great lot of numbers, and guided only by 4 indicators:


- deposit growth,
in% (here, I think, no need to explain anything - the higher it is, the better)


- maximum
drawdown, again in% of the deposit (here, too, it is clear - the less, the
better),


- lifetime
signal


- and stability
work.


Term life - very
an important indicator. If otranzhirovat signals presented at mql5 on this indicator, it is clearly seen that
the longer the signal lives, the less the average monthly income. Thus, for signals
with lifespan of more than 100 weeks, the rate is usually in the range of
from minus 10% to plus 10%. Of course, there are exceptions, but most often it happens.


On the other hand,
possible to isolate another group of signals, which shows just phenomenal
profitability in the hundreds or thousands of percent, the peak of which falls on life
20-40-th week, and then ... you can once again listen to the aria Mephistopheles.


It is in order,
that this did not happen, I propose to use a fourth of the proposed
criteria, which I call stability. If someone likes more
sounding terms, it can be called a dispersion of returns, the essence remains the
change. And it is to give us a clear result
What is the profit earned on a particular signal - happy
chance, luck or a single high-quality, thought-out trading strategy.


Only one
a vivid example (not to engage in any advertising or anti-advertising, specific
Signal names will not give). So:


At the time of writing
this material deposit on a signal increase of X% in 2400 and it is only 20
weeks! Impressive. Drawdown under this yields is also not inspire fears -
only some 15%. But if you look at the monthly rate of return, here we
We see the following picture: January - plus 1,176%, February - plus 85% in March - plus 21%
April - minus 7%, in May - minus 6%.


I do not know how anyone,
but I would not expect here a stable income - a deviation from the
the expectation on both sides in this case may be about
400%, and calculate the efficiency of such an investment is virtually impossible.


for comparison
another signal. Term life is almost the same - 21 weeks, maximum drawdown,
as the previous - 14%, but deposit growth at 10 times less - "only"
115%. In this case, the monthly rate of return
It is as follows: January - plus 9%, February - plus 15% in March - plus 22%, April -
plus 20%, in May - plus 15%. I think, here and without calculations show that in June, and
Further the subscriber may calculate the profit in the range of from 10 to 20%.


Some of us
It prefers the risk and adrenaline, someone - peace and stability. I do not
lazy and using a mql5 statistics, he made simple calculations. It turned out
more than 7000 subscribers who use this service, the category of avid
profit incorrigible optimists two-thirds of us can be attributed. And only one-third
Subscriber carefully analyzed what was singing Mephistopheles.


Anyway,
good luck and so, and others.


Related posts


  • Path novice trader What is it


    Path novice trader. What is it? Path novice trader. What a novice trader faces, and what steps it needs to go. Almost every person who trades the forex...


  • How to choose PAMM account and


    How to choose the PAMM account and control. The Internet is one of the most profitable ways to invest their own money, one of the possibilities earn,...


  • Signal bar shift


    Signal bar shift Signal bar Drawing shift indicators, from what they eat indoor bar and the current bar. Parse examples of indicators portray and...

Next posts


Friday, July 28, 2017

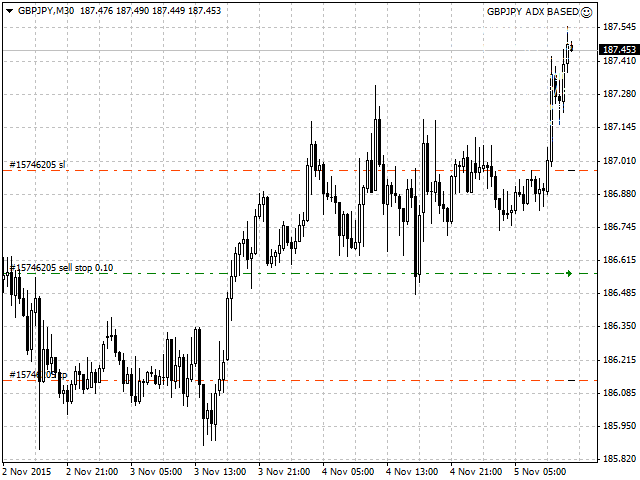
GBPJPY adx based

GBPJPY adx based


Advisor is based on the ADX. EA trades exclusively on GBPJPY. This is a complex and powerful strategy for professional traders and investors. This is not one of those strategies that promises to get rich in a week. To assess its work takes time. When tested on the history of the expert has made more than 484 transactions for the period of 7.5 years with a maximum drawdown of 2.7% and a profit factor of 1.4. the quality of testing in 99% and real tick data provides an advantage over other strategies. Together with Monte Carlo analysis, this strategy has passed tests for reliability and is ready to work without any further optimization.


Note: Do not forget that any strategy are losing periods, so do not panic if you do not profit for a few weeks. I also recommend to get acquainted with my other strategies in order to build a portfolio to maximize profits and minimize losses.


Options


  • MinimumSLTP = 10 - minimum stop-loss / take profit

  • MaximumSLTP = 50 - Maximum stop-loss / take profit

  • UseMoneyManagement = false - enable / disable automatic control of capital

  • Lots Decimals = 2 - broker should support trade micro lot; set the value to 1, if your broker does not support microlots

  • RiskInPercent = 2.0 - risk per trade as a percentage of the account balance using an automatic money management

  • Maximum Lots = 0.5 - maximum lot size

  • Use Fixed Money - use a fixed amount (True / False)

  • Risk In Money - the size of the risk in terms of money instead of the lot or%

  • Max Trades Per Day - the maximum number of trades per day

  • MaxSlippage = 3 - Maximum slippage

  • MagicNumber = 12345 - the magic number for the expert deals

  • CustomComment - user comment

  • DisplayInfoPanel = false - Enable or disable the display of the information panel on the chart

  • All other settings are rather simple. However, if you have any questions, please contact me.


GBPJPY adx based

Related posts


  • Forex Moola Fibonacci


    Forex Moola Fibonacci Expert Forex Moola is based on the grid patterns of trade . He in turn opens the position to buy and sell, and therefore does not...


  • Mr Haas Robot


    Mr Haas Robot Mr Haas Robot - fully automated Forex-Advisor. The strategy is based on the breakdown of price levels using intelligent stop-loss and take-...


  • Recovery Pro


    Recovery Pro It is completely automated and adaptive advisor using restoration algorithm zone (Zone Recovery Algorithm) in strategic places. If you need...


Next posts


Thursday, July 27, 2017

Asian stocks were down on Monday

Asian stocks were down on Monday

fears
Greek default and turbulence
on major world markets affected
today at the Asian stock indexes.
All the major indicators lost APR
not less than 1.25%, while Chinese stocks
also influenced domestic news.


  • Shanghai
    Composite

    decreased
    a further 3.3%. index correction does not deliver
    no signs of deceleration, despite
    the fact that the People's Bank of China lowered
    base rates on loans to 4.85%, and
    annual deposits - to 2%. reduction
    rate followed the collapse
    Shanghai index on Friday, up 7.4%.
    Today he lost another 3.3%. For the last
    Two weeks correction Shanghai
    Composite was
    20%.


    On
    the background of the market experts do not see
    such as weakening the strong, as in
    the 2008 crisis. For support
    shares open opportunities
    within the country, but they provide
    the impact of the international situation. there is
    all are clear signs that the government
    seriously cares about stability
    the economy and the stock market. But,
    Nevertheless, the People's Bank of China did not
    could eliminate current fluctuations
    the stock market. Market analysts expect
    the following steps from the government.


  • Index
    Hang Seng I lost
    2.68%. Legend
    Holdings, a manufacturer
    Motherboard for Lenovo
    Group, showed
    very modest debut on the market. Between
    the fact that IPO
    on
    the market waited as one of the largest
    recently. Against this background, almost
    5% lost securities Lenovo
    Group.


  • Nikkei
    I lost
    2.88%.
    Today
    many currency investors flee to
    the relative calm of the yen against the background
    events in Greece, so it grows.
    It is traditionally weighs on stocks
    exporters, and they, in turn,
    gone down the national stock
    index. Sentiment crushed and internal
    data. Industrial production in Japan
    May decreased by 2.2%. It is much worse,
    than consensus forecasts: pre
    drop was estimated at 0.8%.


    Among
    cheapened companies were, as stated
    above, primarily exporters.
    automakers have been particularly affected.
    Suzuki
    Motor lost
    4.3%; Toyota
    Motor and
    Honda
    lost weight
    on 2%.


    Credit
    sector also retreated: Nomura
    Holdings lost
    2%.


  • S P / ASX
    I lost
    2.2%. Sharp losses suffered bank
    sector and the "blue chips". Now the index
    It is on a five-month low.
    BHP
    Billiton fell
    on 2%. South left and energy
    Company: Woodside
    Petroleum fell
    2.4%; Santos
    cheapened
    1.4%.


    But
    Gold Miners raised again
    head after the gold quotes.
    Evolution
    Mining added
    3.9%; Newcrest
    Mining grew
    1.2%.


  • Key
    Korean index Kospi
    finished
    in the red at 1.4% amid a broad sell-off.
    LG
    Electronics dropped
    on its 11-year low, losing on
    trading Monday 4.8%.


Related posts


  • US stocks rose on Monday


    US stocks rose on Monday, stock US stocks rose on Monday, the expectation that the Fed will be forced to offset concerns about surprisingly weak report...


  • In Asian session major indexes


    In the Asian session , the major indexes all rose Today the major indexes finished the trading in Asia session in the green zone. Investors here feel...


  • Sentiment in Asian markets cool


    Sentiment in Asian markets cool due to weak PMI in China AT Monday declined stock prices virtually the entire Asia-Pacific the region as investors...


Next posts


Wednesday, July 26, 2017

RSI on Realtime Deals

RSI on Realtime Deals


At the time of the transaction script records the value of the indicator Relative Strength Index (RSI) and OHLC price bars.


For quantitative analysis of trade data are stored in .CSV file format. RSI indicator parameters are specified in the input parameters of the script. Information on the location of the file is displayed after stopping the script.


RSI on Realtime Deals

Related posts


  • MACD on History Deals Limited


    MACD on History Deals Limited From the report of transactions is not possible to get the value of the MACD indicator and OHLC prices which were at the...


  • RSI on History Deals


    RSI on History Deals From the report of transactions is not possible to get the value of the indicator Relative Strength Index (RSI) and OHLC prices...


  • Bollinger Bands on Bars


    Bollinger Bands on Bars The script exports the file OHLC prices of each bar on the current graphics and numerical values ​​of Bollinger Bands (BB)...


Next posts


  • IShift Lite

  • Line Crossing Alert

  • Close Positions Delete Pending

Volatility indication of what

Volatility - an indication of what went wrong in the QE something

Marcello Minenna, professor at Milan's Bocconi University, argues that the QE program is developing not quite as originally planned. His opinion was published today on The Wall Street Journal.


"President of the ECB,
Mario Draghi, warned last week,
that "we have to get used to the periods
high volatility. " The yield on the
10-year German bonds jumped
1%, crowning period of two months, during
during which investors watched
very rapid and unexpected jumps in prices
Bond (in different directions).


but Mr.
Draghi was silent about something in his
comments. He explained a new era
increased volatility in the background is extremely
low interest rates natural
forces. ECB President explains
almost no weather conditions that
It is beyond human
control capabilities. It's not only
downplays the ECB responsible for
bringing down the interest rate to nearly
zero, but also ignores the fact that
it is the last monetary program
controller directly contributed
such a sharp increase in volatility.


The main reason
yield fluctuations that began
in April, is simple: traders try
buy low and sell - it's expensive.
The price of bonds fell and yields
rose as investors who
We took advantage of the rise in bond prices
after the announcement of the ECB's large-scale purchases
sovereign debt securities now
They are trying to fix their profits.
This strategy (which has a centuries-old
tradition) interacts with features
QE program, officially
launched in March.


Additional
gosbondy demand as a result of QE
accelerated the decline in yield of
Eurozone bonds. As a result, many
all of them have gone into negative
territory. In April, yield
nine-year German bonds
slid below zero, taking the
even short-term bonds. for the first time
Throughout its history, the same Italian
six-month securities reached zero
profitability. By mid-April the total
the value of debt securities in the euro area
It reached 2.8 trillion euros, a quarter
of them had a negative return.


all trips
about the fact that, in accordance with the rules
ECB set for the QE program,
you can not buy in the secondary market
bonds with a yield of less than 0.2%.
Accordingly, the approach of the debt
paper to yield 0.2% - this is a signal for
trader that it is time to sell it,
because its price will not grow after
it would be unsuitable for participation
in the QE program. Respectively,
from that moment on banks and other investors
begin to create an excess supply
bonds, trying to fix their
profit.


recent fluctuations
prices of German bonds to a large
extent it is this and explained. it
no coincidence: in fact on QE program
ECB buys more and more
bonds. As a result, even a long-term
Bonds are suitable for threatening
Border yield of 0.2%. Similar
dynamics is observed in the sovereign markets
bonds and other euro zone countries, although
where volatility is less pronounced:
negative profitability there is still
not so big spread.


these fluctuations
prices strengthened further and other
QE programs and features
total control policy. For example,
reduced trading volumes, and after them,
- and liquidity. In particular, national
Eurozone central banks accumulate
emergency stocks of public debt.


In the same time,
Private banks are scaling back their
traditional activities as
market maker, because they interfere with
tightening the rules regarding their
capital base. Less paper circulates
in the markets, and the standard trade
strategies may cause significant
price fluctuations.


Consequently,
the nominal value of the sovereign
Eurozone bonds with a negative
yield fell to € 1.3 trillion
a result of the flash crash in April and June.
This autoimmune reaction participants
market on the likely deficit bonds,
held under the rules of QE.
Investors expect that the situation with
liquidity in the best case will remain
at current levels, and may get worse.
Seeing how quickly jump at such prices
politics, some investors reluctant
held at sovereign debt securities
Eurozone - and most simply sells
them when the first hint of trouble.


In the longer term
term, QE will turn
a game of hide and seek between the banks and the ECB.
Regulators will provide money
funds in exchange for government bonds, pushing
prices up to dizzying heights. banks
at the same rate will sell
its assets, preventing reduction in yield.
They are well-equipped to play
these games. At the right moment they will
central banks to sell their large
holdings of sovereign bonds, and in the period
convenient price, they will always be able to use
cash provided by
regulators to buy gosbondy
back in even greater numbers.


even though
a high short-term volatility,
for banks is a very good bargain.
Based on a comparison of average balance
the cost of government bonds in the commercial
banks with an average price at which they
sold by national regulators
in the course of QE, profits already
resulting in the end of the game, already
estimated by some experts
approximately 12 billion euros.


But if banks
pleasure incremented their capital
on a regular basis as a result of
QE program, they are unlikely
We tend to engage in risky
credit schemes of individuals and businesses
- But economists initially
We are counting on the stimulation of these
sectors. This helps explain why
after three years of recession reduction
the volume of bank lending
slowed only very little, and
Now turn to growth is not observed.


recently,
while volatility in the bond markets
- is the result of an error in the program QE,
and not "highlight", in which Mario
Draghi wants so much to make you believe
markets. Instead of the implant
scheme, the ECB should be urgently start
work on its revision - of course,
if it is to have any hope
to achieve its objectives to combat deflation."

Marcello Minenna, specifically for The Wall Street Journal. Retelling - Anomalia


Related posts


  • In developing markets new headache


    In developing markets , a new headache: cheaper commodities In emerging markets for today time was more than enough problems. Suffice it to mention at...


  • Forex ee Economic Daily Digest


    Forex.ee: Economic Daily Digest Keep an eye on major economic news with us Tuesday, August 30 EUR / USD current price: 1.1168 (-0.2%) Range: at the...


  • Larri Vilyams Training important


    Larri Vilyams: Training - important in trading and running Trader and marathon runner Larri Vilyams (Larry Williams) It draws parallels between...


Next posts


Monday, July 24, 2017

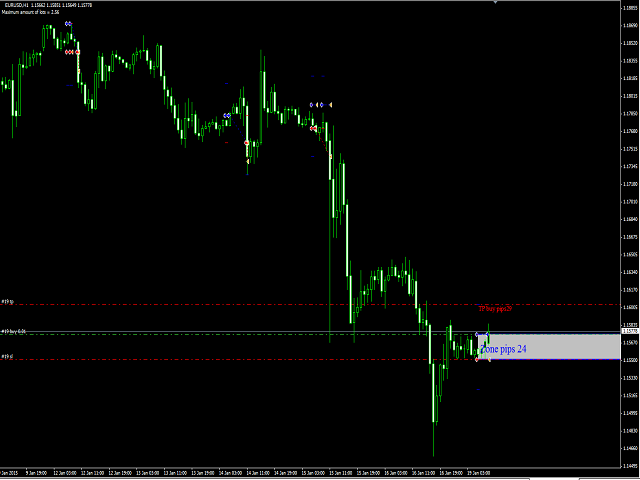
Zone pips

Zone pips


Zone pips - fully automated Forex-Advisor, which uses two types of orders: Buy Stop and Sell Stop. Advisor also uses the system recovery after damage.


It is recommended to expert testing on a demo account MetaQuotes.


timeframe - Only H1.


Input parameters


  • TP - Take Profit.

  • AutoTP - true / false (automatic calculation of take-profit).

  • Min_Zone - minimum recovery zone in pips.

  • Max_Zone - maximum recovery zone in pips.

  • Nbars - minimum number of bars for reduction zone.

  • Lot - the initial lot.

  • Lotmax - the maximum amount.

  • MN - factor.

  • MagicNumber - magic number.

  • slippage - slippage.

  • StartDay - the beginning of trading.

  • StopDay - the end of the trade.


Zone pips

Related posts


  • Universal Partial Close


    Universal Partial Close The eternal question: "How to keep the earned profit?" you can use partial closure (Partial Close - PC). PC do better...


  • FNA MT4


    FNA MT4 Two strategies in one EA! Simple classic strategy of "breakdown at the level of fractals": This strategy may be used on the timeframes M15 and...


  • Phantom


    Phantom Fully automated multi-adviser. Do not apply the martingale, grid trading . For protection use a stop loss. Powered pending orders permitted to...


Next posts


Friday, July 21, 2017

Bulls and Bears indicator

Bulls and Bears indicator


Bulls and Bears Indicator


An indicator showing who is dominant at the moment on the market: buyers (Bulls-bulls) or sellers (Bears-Bears).


Glossary


About terms of the Bulls and the Bears first wrote K. Johnson in 1714. In the book «Country Lasses» he says about these categories of gamblers and especially their trade.


So bulls Forex - traders is playing in the rise of the market or at least count on the increase in the price of a particular financial instrument.


The origin of the name is inspired by the analogy - the bulls lifted the enemy on the horns, throwing it up - just trader bull "raise" the price for its aggressive shopping. Wild bear bore down on the enemy, or the victim, pressing the ground with their weight. Similarly, a trader bear tends to lower prices and increase supply. To do this, it opens a short position and sell, sell, while prices will not fall to the desired level.


In contrast to the stock exchange, foreign exchange operates on the exchange rates, acts as a financial instrument.


Therefore, the forex market bulls and bears are expected to rise or, respectively, the fall of the exchange rate, and to achieve the purpose they buy or sell the base currency against the quote.


on display


As mentioned earlier, this indicator shows who is dominant at the moment.


Color scheme:


  • Bulls - bar chart. Color - DodgerBlue. It reflects the dynamics of change in the propensity to buy at a given time.

  • Bears - bar chart. Color - Orange. It reflects the dynamics of change in the propensity for sale at any given time.

  • BLBR_MA - moving average. Color - White. Built according to Bulls and Bears. The main purpose - an additional landmark. The increase in this average indicates that at the moment the tendency to buy more than a penchant for sale. Reduction indicates that at this point in time the tendency to sell more than the propensity to buy.

  • BLBR_UP and BLBR_DW - These two lines form a channel within which the value varies BLBR_MA. If BLBR_MA leaves the channel or touches the channel boundaries (BLBR_UP or BLBR_DW), then at the bar must pay attention, because the High and Low prices of the bar can serve in the subsequent levels of resistance / support respectively. Or penetration of these levels will open the way for the continuation of the ascending / descending trend.


An indicator:


  • BLBRperiod - averaging period, data histograms Bulls (DodgerBlue) and Bears (Orange).

  • BLBRmethod - averaging method.

  • MA_BLBRperiod - averaging period moving average BLBR_MA (White), constructed according Bulls and Bears.

  • MA_BLBRmethod - method of averaging the moving average.

  • Channel - true - show the channel; false - do not show the channel.


It was said above about the role and BLBR_UP BLBR_DW together with BLBR_MA. Therefore, it is recommended to use one and the same averaging method, and averaging periods must differ from each other in three or more times. In this histogram averaging period should be longer averaging period moving average.


Bulls and Bears indicator

Related posts


  • TradeLeader Indicator


    TradeLeader Indicator Signal indicator, based on the volatility of the asset. It tracks the volume levels of volatility and market movements with the...


  • Elder AutoEnvelope


    Elder AutoEnvelope Envelopes (Envelopes) or channel lines are similar to moving averages (or slow MA with two MA). Inside the channel lines daily...


  • Ultimate Strength Meter Strong


    Ultimate Strength Meter Strong VS Weak The indicator was created by a former employee of the hedge fund, and it is specifically designed to measure the...


Next posts


Batman

Batman Batman Advisor is based on a very simple system that uses ZigZag indicator and breakdown strategy. Transactions are opened only whe...