Wednesday, May 10, 2017

TSO Currency Trend Aggregator MT5

TSO Currency Trend Aggregator MT5


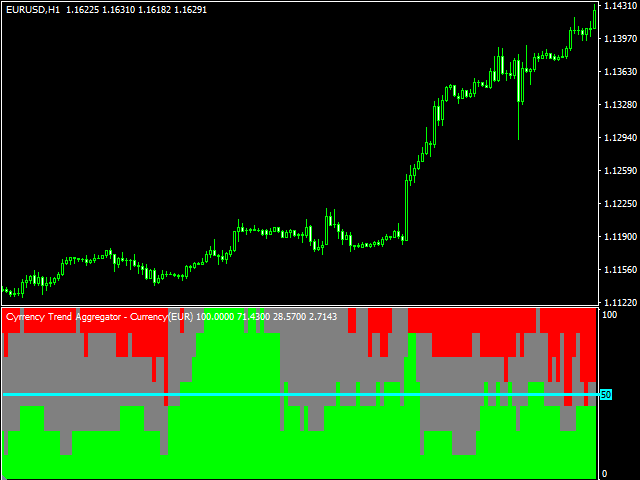
Indicator TSO Currency Trend Aggregator job compares the behavior of currency pairs 7.


  • It allows you to instantly compare the behavior of the currency in 7 different pairs.

  • Easily obtain confirmation of currency strength

  • Use the indicator for both currency pairs to get the complete picture of how strong / weak each currency.

  • The trend can be positive (green), negative (red) or neutral (gray).

  • Can be used as part of the adviser (see. Below)


currency


  1. EUR

  2. USD

  3. GBP

  4. JPY

  5. AUD

  6. NZD

  7. CAD

  8. CHF


define


  1. Positive trend (green):fast moving average is above the slow and below the current price.

  2. A negative trend (red):fast moving average is below the slow and above the current price.

  3. A neutral (gray): any other location.


Indicator simultaneously reads the price of 7 different forex pairs. Before testing the strategy tester, make sure that the price history is loaded for all pairs. The indicator shows the trend signals only for the period for which has all the necessary data for all couples. If the data for any period not, at this period of the signal will not be.


Input parameters


  1. Symbol: to match the currency.

  2. Prefix: if your broker uses a prefix in the names of the currency pairs, enter it here.

  3. suffix: if your broker uses a suffix in the names of the currency pairs, enter it here (eg, enter .m for EURUSD.m)

  4. Timeframe: Timeframe moving averages.

  5. Fast MA Period: during the fast moving average.

  6. Fast MA Method: type of smoothing the fast moving average.

  7. Fast MA Applied Price: the price used to calculate the faster moving average.

  8. Slow MA Period: period of slow moving average.

  9. Slow MA Method: type of smoothing of the slow moving average.

  10. Slow MA Applied Price: the price used to calculate the slow moving average.


developers advisers


  • Buffer 3: return type double value with two characters after the decimal point.


    • The value on the left of the decimal point indicates the dominant trend, and can be as follows:


      • 0 = rising trend

      • 1 = falling trend

      • 2 = no trend


    • Value to the right of the decimal point indicates the percentage of steam in the dominant trend are rounded to two decimal:

    • For example, if a dominant trend is downward (1), And 3 of 7 pairs observed downtrend (3/7 * 100? 43) Return value is 1.43.


TSO Currency Trend Aggregator MT5

Related posts


  • Moving Average Price Level


    Moving Average Price Level Moving Average displaying price tags. settings Period MA - MA period; Shift MA - displacement of MA; Method MA - smoothing...


  • Bulls and Bears indicator


    Bulls and Bears indicator Bulls and Bears Indicator An indicator showing who is dominant at the moment on the market : buyers (Bulls-bulls) or sellers...


  • Kagi Chart


    kagi Chart Kagi Chart indicator can display graphics "Kagi" in the indicator window. Graphics Type "Kagi" filters out unwanted noise and help identify...


Next posts


Monday, May 8, 2017

Pershikov Fibonacci Retracement

Pershikov Fibonacci Retracement


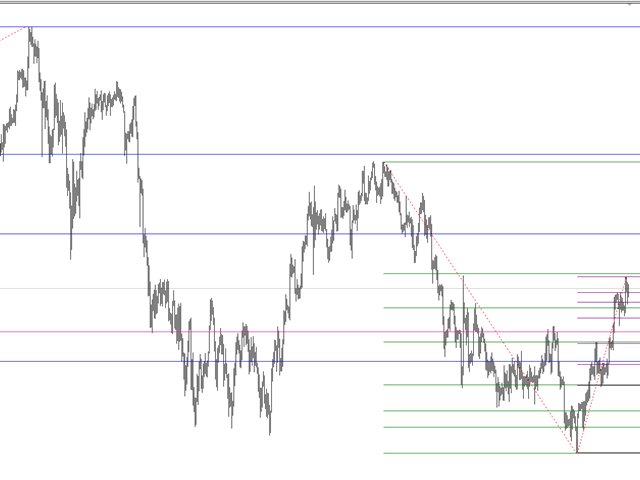
5 The indicator plots the Fibonacci retracements in accordance with the recommendations of the lifetime V.V.Pershikova trend. All parameters are configurable lifetime. Construction takes place only at the moment of accession to the schedule, and at the time of zooming. This is done to improve performance, if the indicator is to be reconstructed on each tick, things will slow down because of the large number of calculations related to test the breakdown level of 61.8. After building retracement indicator may change hands to build. So that the indicator is not brought down the manual changes, it must be removed from the chart, retracements is not deleted.


The indicator was developed in collaboration with VV Pershikov.


Item display


Trend parameters


  • EndBarNumber = 1 - This parameter is used to determine the last candle, which build up a retrace. The default is 1 - this is the penultimate candle on the chart (0 - current). Current candle is not yet complete, so if you put 0, then we must be prepared to redraw.


Trend break parameters - Adjustable parameters for the breakdown of the trend.


  • TrendBreakEndLevel = 0.618 - Level, which must be broken to be considered a "cancel" on the trend and the breakdown of which is being verified by the construction of retracements. The default setting for V.Pershikovu 61.8.

  • TrendBreakCandlePercent = 100 - The percentage of the real body, which must penetrate the established level of cancellation of the trend to the cancellation has been fixed. Attention! According V.V.Pershikovu this percentage = 66%. The default display is worth 100%. Those. all the body of the candle must be above / below the level.

  • ShowAdditionalLevels = false - at a value of True indicates additional levels of 76.4, 85.4, 91.


Next come the construction of settings retracements for each timeframe. I will describe only the H1 setup, the rest - by analogy.


  • NameH1 = "PRH1" - The name Fibonacci Lines

  • TrendMinBarsH1 = 10 - The minimum number of H1 TF bars in the trend, which is built on the retracement

  • TrendMaxBarsH1 = 400 - The maximum number of H1 TF bars for building retracement

  • TrendMinSizeH1 = 0 - The minimum number of pips in the trend (which is pips - no points, ie EURUSD 1.10182 item - mark 4 (8), pip - 5th (2)), if it is less, it will be considered that there is no trend.

  • FiboColorH1 = Purple - Color retracement. Is taken as the default in V.Pershikova

  • FiboStyleH1 = 0 - Style reyreysmenta lines (dashed, dash-dotted)

  • FiboWidthH1 = 1 - The thickness of the retracement lines

  • BreakCheckStep = 1 - parameters that affect performance. Breakdown trend calculation is not conducted to each candle, and by the number of suppositories, the above parameter. If performance issues are not observed, leave the default.


Pershikov Fibonacci Retracement

Related posts


  • Pinbar Scanner With Trend Filter


    Pinbar Scanner With Trend Filter The indicator was created by the former employee of the hedge fund. It automatically determines the most probable pin...


  • Katong Zigzag


    Katong Zigzag This indicator is a modification of the original zigzag. I usually use the indicator on the GBPUSD with timeframe H4. This indicator works...


  • DoubleMultiTimeFrameMA


    DoubleMultiTimeFrameMA Multiple timeframe indicator based on moving averages. You can adjust the parameters of the two moving averages that you see on...


Next posts


Friday, May 5, 2017

Easy Trader EA

Easy Trader EA


Robot Day Trading Easy Trader EA


This EA is designed to trade a couple USDCHF on the chart H1. In fact, it is not profitable to any other schedule or timeframe.


This is completely automated trading robot with a small number of settings, not to confuse new traders.


He uses price action and math to calculate the best point to enter the market in the direction of the current short-term trend. For calculations automatic profit-taking indicators are used.


Easy Trader EA does not load the processor, memory, your broker's server and your internet traffic.


The adviser usually closes the position on the same day that opened, but sometimes keeps the open positions for a few days.


It trades infrequently. He makes an average of 1 - 2 trades per week.


This EA is always open market orders with a stop-loss and take-profit. Your profit protected automatic profit-taking.


Business operations are mainly carried out during the London trading session. Namely, from 7:00 to 13:00 according to GMT. This adviser works best with brokers who have the server time is set to GMT + 2.


Features Trading Robot


  • Price action

  • income protection

  • not scalping

  • without martingale

  • The algorithm is not based on indicators

  • Easy to use

  • Do not load the computer

  • Do not load the connection broker

  • No special requirements for brokers

  • It does not require a VPS

  • Protect account

  • Concealed stop-loss - in case, if you believe in hunting for stop-loss


Customization:


  • GMT_Offset - offset GMT, default 2. Set time your broker server, if it is different.

  • MagicNumber - magic number adviser.

  • Lots - lot size, default 0.01

  • AutoMoneyManagement - Automatic money management, default is set true, which overrides Lots. When installing false, the volume of transactions will be equal Lots.

  • AccountPercentToRisk - the percentage of the account risk, default 5. If AutoMoneyManagement is true, the transaction volume is calculated using AccountPercentToRisk. Maximum permissible risk robot is 20% of the available funds.

  • Stop_Loss - stop loss, default 126.

  • Real_Stop_Loss - the actual stop-loss, the default 120. This option is hidden from the broker.

  • Take_Profit - take profit, default 120.

  • FridayEveningClose - closed on Friday evening, the default - false. Set true, if the position should not be held over the weekend.

  • MaxSpread - maximum spread, default 2. This robot will not be open long positions if the current spread is greater than the specified maximum.

  • Slipagge - slippage, default 1. This robot will not open the position if the price difference is more than the specified maximum.

  • ECN - true by default. The robot will send the stop-loss and take-profit to the server after the opening position. Set to false, if your broker does not require it.

  • Auto_ProfitLock - automatic profit-taking, default true. Advanced empirical calculation of profit levels.


Easy Trader EA

Related posts


  • Robust Trader 20 EAs


    Robust Trader 20 EAs 9 most terrible secrets of scalpers who make you lose money Scalper tested under ideal spreads, i.e. 0.5 or 1.0 pips? Your broker...


  • Statistic Trader


    statistic Trader Expert statistic Trader - this trading strategies, based on two ideas: the idea of ​​probability occurrence of an event and the idea of...


  • EasyTrading Reversal Expert


    EasyTrading Reversal Expert AlwaysWin Expert represents fully automated trading robot , which opens / closes the market position on your behalf and...


Next posts


Asia stock closed in red zone

Asia stock closed in red zone after Chinese reports

Today, 1
September stock index
Asia-Pacific region again
showed a reduction - after
data on business activity in the
Processing Industry in China
We proved that the reduction is the highest in
last years rates. Besides,
increased fears that intervention
Chinese authorities in the stock market is not
bring results. On Monday
Japanese yen and gold rose in price - their
is considered as the best protection
assets, while oil prices
resumed falling.


According to the results
Bid now consolidated stock index
region MSCI Asia Pacific sank to 1.3%
Chinese Shanghai Composite index fell
1,28%, Shenzhen Composite - 4.61%, Hong Kong's Hang
Seng - 2.6%, Japanese Nikkei 225 - 3.84%, more
broader index Topix - on 3,83%, Australian
S P / ASX 200 - 2.12%, South Kospi -
1.4%.


"Industrial
China's index still shows
that the economy is in the process
Search bottom. The market is unlikely to resume
In the near future growth"- sure
fund manager JK Life Insurance Wu Kan.


Index,
published by the National Bureau of Statistics,
He went into negative territory, reaching
up to August minimum of three
last year, 49.7 points versus 50 points
in July. Another index of Caixin / Markit showed
up to August 47.3 points.


shares of China
Eastern Airlines Corp. fell by 5,3%, China Southern Airlines
lost in the price of 10% - air carriers
late to react to rising oil prices.
Shares of Toshiba Corp. fell by 4.9% because
the company is the second time delays
publication for the last quarter of the reporting
due to problems in accounting.


Related posts


  • Stock Asia traded mixed on Tuesd


    Stock Asia traded mixed on Tuesday Today Asian stock indexes finished mixed. investors doubted the effectiveness of state intervention in the the Chinese...


  • US stock markets closed mixed


    US stock markets closed mixed , Dow Jones added 0.40% The US stock market closed the trading session on Monday in different directions due to the...


  • Overview of Russian stock market


    Overview of the Russian stock market and oil market Overview of the Russian stock market and the oil market. Russian stock market closed yesterday mixed....


Next posts


Thursday, May 4, 2017

Dovish FOMC minute lifted gold

Dovish FOMC minute lifted gold to a five-week high

at today
trading gold rose to the
highest level in the last five
weeks. K 11.22 MSK yellow metal with the delivery
in December worth 1 137,00 dollar, adding
0.81%. Investors interpreted the released
FOMC minutes yesterday, from
which it is clear that the growth rate
US Fed rates may be postponed.


September
monetary tightening start
is becoming less probable: the backlog
inflation and a general weakening of the world
the economy is simply too big
risks. Today, traders and evaluated more
the fact that the "minutes" left to the
a three-week delay, and since
again he collapsed and there was oil
devaluation of the RMB, all peretryahnuvshaya
Asian markets.


traders
Gold hopes to increase the probability
growth rate in December, and it gives prices
the yellow metal support in the short
term.


gold now
It is on track for the second
consecutive weekly increase. potential
delay in raising rates until December
It suggests a potential increase in purchases
non-interest assets - such as
precious metals. elementary
resistance, which experts see
market is at $ 1
150. This was the price the last time it was possible to
observed in May. The move to this level
It can be seen in the short term,
Now technically bullish for the gold formed conditions.


Related posts


  • Gold slightly decreased on Wed


    Gold slightly decreased on Wednesday Dollar recovers losses against the euro eve performances of heads ECB. There are prospects that deal on Greece may...


  • Engines markets major events of


    Engines markets: major events of the week The key economic data this week will be the figures of inflation and the US housing market . It is also...


  • Gold futures on five year low


    Gold futures on the five-year low in light of the strengthening of the dollar Today to 14.15 MSK gold futures fell another 0.34% and cost $ 1079.70 per...


Next posts


Tuesday, May 2, 2017

Tesla Power Trends

Tesla Power Trends


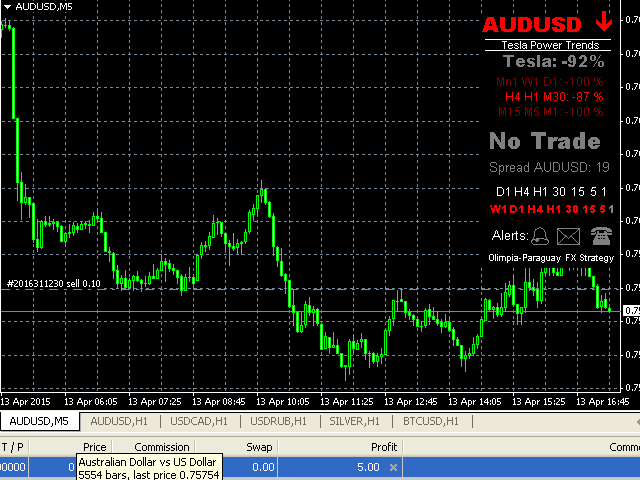
Tesla Power Trends - it is simple and visual indicator that works with the most probable combinations and predicting space passing trend. Based on current data and is updated after each new tick. This is an excellent tool for all investors.


What is displayed on the screen


  • Steam and an arrow (arrow to the right displays the underlying trend. Indicates that the current trend is strong and stable enough for a given direction).


    • EURUSD <- (Red - down direction, D1 and W1 candles go down)

    • EURUSD ---> (Green - the upward direction, D1 and W1 candles go up)

    • EURUSD / \ / \ /(Gray and variation between D1 and W1 is an unstable trend)


  • Percent Tesla (%): (more than 0%, the rising trend, green) (0% and less negative value, the downward trend, the red color)


    Calculated strictly by a formula in accordance with a combination of the price action and the current trend direction. (From 50% a significant shift in the trend by 90% - the trend of late). Regardless of your trading style is always necessary to know the right direction you are trading.


    These percentages are average values ​​timeframes combination H4 and M5. They help determine the most accurate entry point.


  • Periods Tesla percentage (more than 0%, the rising trend, green) (0% and less negative value, the downward trend, the red color)


    • Tesla Mn1, W1, D1%: Tesla Power displays the trend in those timeframes. Long periods (especially for trading positions)

    • Tesla H4, H1, M30%: Tesla Power displays the trend in those timeframes. Average periods.

    • Tesla M15, M5, M1%: Tesla Power displays the trend in those timeframes. Short periods.


  • Input Settings: Inscription "NO TRADE", "Buy", "Sell" prompt a good time to setup and login.


  • spread: The value of the spread pair: gray - exceeds a minimum value Spread you specified in the parameters, orange - below the minimum value.


  • volume: information D1, H1, 60, 30, 15, 5, 1 It displays the current amount of candles.


    When "white" values ​​of the volume of the current candle below the average. "Blue" value means that the amount of the current candle above average volume or volume last 120 candles.


  • candles direction: Information W1, D1, H1, 60, 30, 15, 5, 1 It displays the direction candles since it was opened (green color - the upward movement, the color red - the downward movement).


  • Alerts and messages: Icon with the image of the bell, letter or phone suggests the importance - or True The False The - you set configuration for sending alerts, e-mail and notifications (gray - not activated, the orange color - option enabled).


Item display


  • Tesla Power% minimum: 50. The default - 50%, 0 to 49% - trends in this area is still strong. From 50 to 75% - a good time to set orders, more than 75% - the trend too retreated.

  • Alerts only Spread less than: 15. The default - 15. Notifies pairs with a spread value smaller than this value.

  • Enable messages. Pop-up alerts, e-mail and / or notification.


Note


No longer need to decide on a time frame or schedule set better adviser. It is programmed to use any pair or financial instrument with the notification of open orders and on the panel display. The indicator can be used on any pair or financial instrument that is compatible with MetaTrader 4.


LED has a high accuracy in a significant trend change moments. Not suitable for couples or trending markets. Do not use when expected to yield significant news.


You run the risk of losing some or all of your funds, even using this EA. Invest only within your ability. Before applying the Tesla Power Trends indicator refer to the risks associated with foreign exchange trading.
Tesla Power Trends

Related posts


  • RealVolume4


    RealVolume4 Everyone who trades on the VSA, know how important volume. Unfortunately, teak or spot volumes are not suitable for these purposes. With the...


  • Vidente


    Vidente Advantage: The others do not know (yet). Indicator Vidente for MetaTrader - tool to determine the price trend . For beginners it is a great help...


  • NewBbandsMT4


    NewBbandsMT4 Probably every trader known indicator Bollinger Bands (Bollinger Bands). This indicator is similar to moving average envelopes, but based on...


Next posts


Auxiliary forex tools

Auxiliary forex tools.

Trade on any of the exchanges is a pretty difficult task, so why not make it a little easier for these purposes, various forex tools.

Instruments Forex - a special program, scripts, widgets, techniques and other ways to obtain additional information that will increase the chances of success.

Indicators of technical analysis - rarely find a trader who is not using this tool, it displays allow for a more effective analysis of the forex market. There are several groups of indicators, some are studying the trend, others produce the construction of lines and levels, and others assess the state of the market.


Forex scripts - make trading easier and more comfortable for the most part perform auxiliary functions, such as managing orders, withdrawal of useful information, etc.

Demo account - what could be better to check personally developed strategies or just downloaded the indicator, only a demo account. It is also excellent training ground when studying trader trading terminal, you can work out at the opening of orders or the management of existing positions.

Widgets - there are a lot of useful things, so that you can learn - on which session you are currently trading, the current rates of national banks, or how soon will this or that news on your currency. A good example of such Informer are FX calendar and currency rates.

Books about Forex - as no surprise even books can act as a forex tools, because thanks to them you get the information you need on the trade on the stock exchange. It received information improves the efficiency of your trading.

Feel free to use any opportunity to get more information, because in the financial world, winning only one who owns the information.

Related posts


  • Gold Trading Forex


    Gold Trading Forex. In spite of their belonging to the precious metals gold is also the subject of intense speculation in the forex market . gold on the...


  • Recommendations for forex trading


    Recommendations for forex trading. Currently, Forex trading has gained a huge popularity, every day there are new comers to do online trading , but they...


  • AUTOMATIC Forex trading


    AUTOMATIC Forex trading Did you know that in Forex, you can quickly put together yourself state? You do not know how to trade the forex market? Did you...


Next posts


Batman

Batman Batman Advisor is based on a very simple system that uses ZigZag indicator and breakdown strategy. Transactions are opened only whe...