Friday, August 31, 2018

Gold goes lower and lower

Gold goes lower and lower

Again, the Asian session, there is decline in gold futures prices. Thus, in the division of the New York Mercantile Exchange, the Comex, gold for August delivery traded at $ 1.311,90 an ounce.


Gold is likely to find support at $ 1.298,10 and resistance at $ 1.325,90.


Index
The dollar, which tracks the performance
the dollar against a basket of six other
Majors changed by 0.01% and
It is trading at $ 80.63.


In the same time
the September silver index traded
at $ 20.965
per troy ounce, while copper - $ 3,219
per pound.


Related posts


  • Gold becomes cheaper when dollar


    Gold becomes cheaper when the dollar strengthens Gold prices are falling on the background of strengthening the dollar. However, gold still continues to...


  • Gold rose but apparently not for


    Gold rose , but apparently not for long Today prices gold goes up. Now (at 13.30 MSK) It is trading at 1 200.40 USD per troy ounce, gaining 0.29% on the...


  • Gold rises in price against backdrop


    Gold rises in price against the backdrop of a weak dollar on Friday The price of gold rises up during the Asian session on Friday morning. Investors...


Next posts


  • Formula that has changed stock

  • Gloomy predictions of Bundesbank

  • Oil futures stably reduced Monday

Free automatic fibonacci

Free automatic fibonacci


Free automatic fibonacci - is an indicator that automatically builds Fibonacci correction, based on the number of bars, selected in BarsToScan parameter. Fibonacci lines are automatically updated in real time when new maximum and minimum values ​​among the selected bars. The display settings can be chosen levels, the values ​​of which are displayed. You can also choose the color levels, which allows the trader to attach the indicator several times with different settings and colors. Settings are described below:


  • BarsToScan - The number of bars to check the value of the indicator

  • Level_1 - The first Fibonacci level

  • Level_2 - The second Fibonacci level

  • Level_3 - The third level of Fibonacci

  • Level_4 - Fourth Fibonacci level

  • Level_5 - Fifth Fibonacci level

  • Level_6 - Sixth Fibonacci level

  • LevelsColor - Color Fibonacci

  • FiboName - Name of Fibonacci levels. When you install multiple copies of the indicator, they must have different names Fibonacci levels.


Free automatic fibonacci

Related posts


  • Vola Alarm Free


    Vola Alarm Free Vola Alarm shows the current value of the price movement since the opening of the bar at a percentage of the average price movement ....


  • Fibonacci Swing Scalp


    Fibonacci Swing Scalp Fibonacci Swing Scalp (Fibonacci-SS) The indicator automatically sets Fibonacci line on the highs and lows of the visible part of...


  • Pershikov Fibonacci Retracement


    Pershikov Fibonacci Retracement 5 The indicator plots the Fibonacci retracements in accordance with the recommendations of the lifetime V.V.Pershikova...


Next posts


  • SuperTrend Alerts

  • TR Breakout Patterns Scanner

  • BigTrendTrapSignal

Wednesday, August 29, 2018

Economists still believe

Economists still believe?

In 2010 he published a famous work Kenetta economists Rogoff and Carmen Reinhart of the fact that public debt levels in excess of 90% of GDP growth slowing sharply and recession occurs.
Since then, this figure is known to all, even politicians were guided by it. However, came a mishap!
The authors of a new publication shows that, after correction methodology, countries with high debt levels, instead of negative growth show a positive.
It turns out that the theoretical basis of austerity policies was a simple error in Microsoft Excel. Simply super!

PS see details in the original.


Related posts


  • Press service of Rosneft CB shoot


    Press-service of Rosneft: CB shoot economy to not suffered Today, only the lazy I have spoken about the increase the central bank base rate. And another...


  • Opinion crisis in emerging markets


    Opinion: The crisis in emerging markets - the third wave of global financial crisis downturn in emerging markets - is not just a the result of the local...


  • S P 500 goes on his last journey


    S P 500 goes on his last journey? US stock index S P 500 rising again. Yet some two weeks ago in the investment community it was a real hysteria caused...


Next posts


  • Gold goes lower and lower

  • Formula that has changed stock

  • Gloomy predictions of Bundesbank

Tuesday, August 28, 2018

Main difficulty in development

The main difficulty in the development of trend-following strategies

Trendsledyaschie strategy is simple in its logic, robust in the trade, but not all so simple ...


The strategy is necessary to solve a few subtle highlights, and the most difficult point is the portion of the change of the trend.


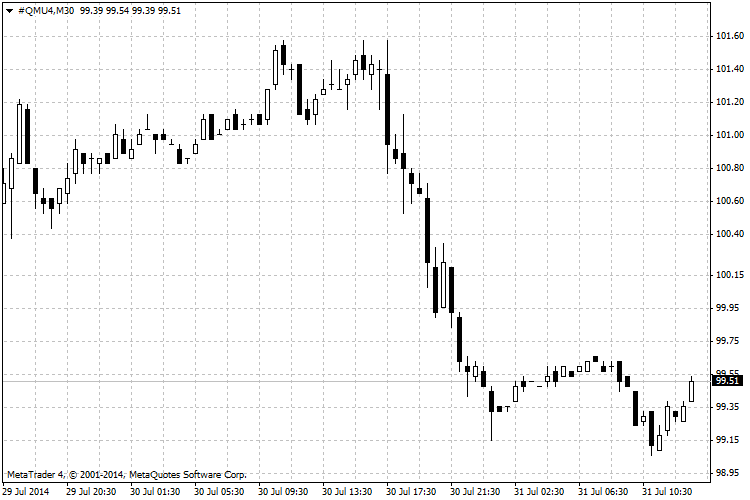
Consider a typical example:


Main difficulty in development


Here, it seems, it began a strong movement against the trend, and there are two options
further development (lagging indicators with a signal at such a strong
move):


1. This is a strong pullback, and after some time the trend will continue.

2. This is a reversal of the trend, but the lights do not have time to identify it because
sharp price movements.


Work on pullbacks - it is against the ideology trendsledyaschih strategies so
the ideal solution is not to enter the market at such times, and wait
clarify the situation.


One solution to this problem is to fine tune intraday module (not to be confused with the general trend of the module).
That he will not take a position until a confirmation signal
the general trend.

But this solution is not the only thing - you can always find a few different
options for solving this problem.


Question: The general trend does not react to setbacks, which
can be very large. What can be done to reduce their impact on the
strategy results?


That the correction is possible, that's right - sawtooth currency movements
It has not been canceled, but the force rollback is not possible to calculate. Rollback can be
strong or weak, or horizontal, or generally can not be. here
question: Why rely on the figure, which is not possible to calculate?
The strategy should be based on rules that are clear and understandable, in this case,
availability and trend direction. That is why a modular applied
strategy building. And intraday trend module is designed for fixation
We arrived at strong pullbacks and this is why it is not recommended to trade only
the signals of the general trend.


There is another subtle point in trendsledyaschih strategies. it
when a trend changes direction with the transition through the flat section. This
The situation in large plots general trend is a rare, but very not
pleasant, because at such a site strategy gives a lot of false signals.


Here are a few solutions:

1. General trend duplication signals from another
Graphics: for example, if the general trend is considered to 12:00 chart,
added signals calculated with 18 hour schedule or daily schedule. This will reduce the
trading frequency, but it will dramatically increase its reliability.

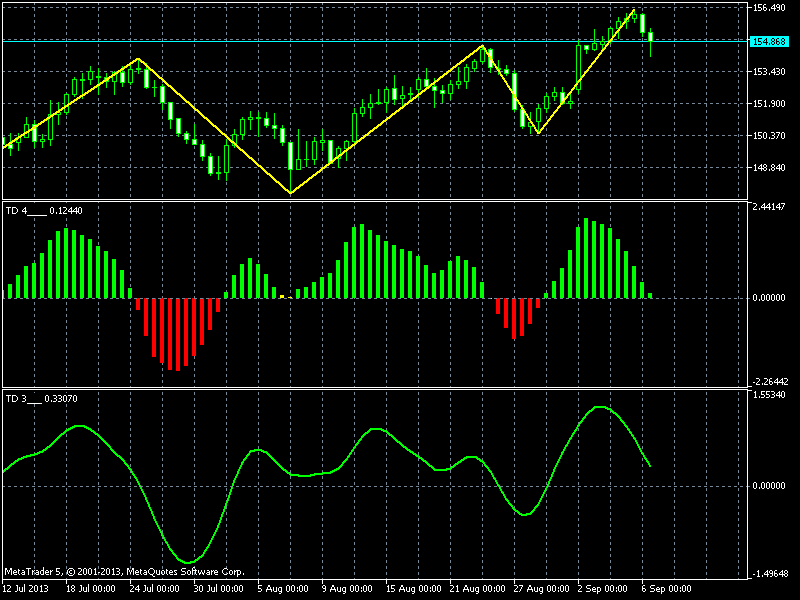
2. apply a smoother indicator, such as here - https://www.mql5.com/ru/blogs/post/81.

3. certain there are other possible solutions.


Related posts


  • Price Action from Nyala Fuller


    Price Action from Nyala Fuller How to create your own trading plan I found that most traders do not have a trading plan, they do not know how him to do,...


  • To hedge market you can use futures


    To hedge the market , you can use futures and options novice traders often think, what is needed are financial instruments such as futures Options. Can I...


  • Bloomberg five main themes of


    Bloomberg: the five main themes of this Friday , from Yanis Varoufakis to Nasdaq Bloomberg It lists the main events, which will be remembered for today's...


Next posts


  • Economists still believe

  • Gold goes lower and lower

  • Formula that has changed stock

WTI crude oil fell below $ 100

WTI crude oil fell below $ 100 on the call against the demand

Thursday afternoon oil futures West Texas Intermediate (WTI) fell below $ 100, since as concerns about US demand for oil and gasoline have increased.


During morning trading on the New York Mercantile Exchange WTI crude oil for September delivery reached a session low of $ 99.18 per barrel (at least from 15 July). Wednesday futures traded at $ 100.27 a barrel.


Continued growth
gasoline stocks during the peak summer
driving season in the US is putting pressure
on oil prices, as well as rumors of
decline in demand.

Now the schedule of oil is as follows:

WTI crude oil fell below $ 100


On Friday, investors
expect the data to change the number
engaged in non-agricultural
US private sector in July, which will point to
the degree of recovery in the labor market.


On the ICE exchange in London
Brent crude oil for September delivery fell
to $ 105.94 a barrel, the lowest level
on July 15.


Related posts


  • Brent crude oil fell to $ 82 38


    Brent crude oil fell to $ 82.38 During trading on Wednesday morning, the price of oil falling to record lows already fifth session in a row. Investors...


  • Price of Brent crude oil fell


    The price of Brent crude oil fell below $ 40 The price of Brent crude oil for the first time since mid-March has gone below the important psychological...


  • Ruble fell in anticipation of


    The ruble fell in anticipation of the Central Bank meeting and amid weak activity Exporters This afternoon, the Russian Ruble reduced trades the currency...


Next posts


  • Main difficulty in development

  • Economists still believe

  • Gold goes lower and lower

Monday, August 27, 2018

Gfx EJ Volbo

Gfx EJ Volbo


Advisor for serious traders and patient. The product is based on the breakthrough volatility system (volatility breakout system), following the trend, and trades EURJPY. Even taking into account the fact that the results in the past do not guarantee income in the future, we believe that this system significantly declines the odds in your favor:


  • Reasonable principle (breakthrough volatility -> trend following).

  • price action system (price action system) with one indicator (ATR is used for measuring the volatility).

  • The positive ratio of profit to risk (average profitable trade / losing trade average = 184/138 = 1.33).

  • odds - 56%: it is easier to trade psychologically.

  • Excellent profit factor (net profit / drawdown makismalnaya = 10.07). Works well in mixed-mode (compounding mode).

  • Reliable: during the optimization parameter combinations 96% (691/720) were profitable (see figure 3.).

  • High earning potential (45 $ / 1 mini lots). Advisor less sensitive to the spread and can be used with any broker.

  • 259 trades over 5 years (50 trades per year). Test results on the history statistically significant.

  • For each trade set stop loss. You can safely go about their business as long as the adviser does the work for you.

  • The minimum initial capital - only $ 250 for micro accounts ($ 500 - a more conservative figure).


Some characteristics:


  • Compatible with ECN. 4/5-digits quotes.

  • Without hedging.

  • Without martingale and refills to a losing position.

  • One item per week. The position is always closed before the weekend.

  • The maximum duration of the drawdown was 8 months for a period of 5 years. However, the drawdown was justified. For profit must be patient.

  • Two mixed algorithm (compounding algorithms): 1 = fixed risk; 2 = fixed margin. This is the main advantage of the adviser. The mixing is accompanied by large changes equity (large equity swing). Figure 4 shows a profit in mixed mode for 5 years with a starting capital of $ 1000.

  • With these parameters effectively adviser working on 14 currency pairs 24. Some of the currency pair in particular are often found in the trend, whereas others return to the mean value (see. Figure 5).


Gfx EJ Volbo

Related posts


  • Exp TickSniper FULL


    Exp TickSniper FULL This expert is able to capture the rapid movement quotes and currency pair open transaction in the direction of movement. All the...


  • Break Price Channel Martingale


    Break Price Channel Martingale Expert Break Price Channel Martingale . Here is a brief description. A more detailed description can be found on my blog...


  • My Exchange Office


    My Exchange Office Advisor is designed to trade on real accounts of MT5 platform. In the EA trading strategy is implemented with the trend. Opening...


Next posts


  • ENS Pilot

  • AnalyzerNeuralNetwork

  • COSMOS4U AdMACD EA MT5

Friday, August 24, 2018

Secret Scalper

Secret Scalper


Secret Scalper - fully automated Advisor. It is a medium-term scalper.


Designed for covert operation. Adviser closes warrant a gain or loss on the value in the account currency. Also sets a stop loss. Powered by medium- and low-risk strategy. You can increase your risk if you wish, but this is not recommended.


Adviser The logic is quite complex. But he at the same time easy to use. Most of the settings are set automatically when you change the timeframe. EA opens the transaction with one of the following events:


  1. Advisor looking for some patterns of price action (price action).

  2. indicator is displayed when it detects a suitable pattern.

  3. The transaction may be provided with take-profit.

  4. If the first transaction unprofitable and Max Orders is not 1, the adviser is waiting for the next trading opportunity on the icon. If you set Min Distance value Advisor will not open other transactions to achieve the specified value even when it detects a good trading opportunity.

  5. Upon reaching the Min Distance Advisor will open the second deal. Advisor starts to work again until the Max Orders and Profit To Close.

  6. Advisor always monitors the profit or loss on each tick. Upon reaching the profit or loss of the specified value, Advisor covers all orders for the symbol. However, we recommend not to set too little value for Loss To Close, as the main feature of the adviser - recovery system after losses.


requirements


  • timeframe: H1

  • symbols: AUDCAD, AUDCHF, AUDJPY, AUDUSD, EURCHF, EURJPY, EURUSD, GBPUSD, USDJPY

  • A number of simbols after comma: any

  • Broker: ECN or any

  • Server: VPS with a low ping to your broker's server

  • Balance and Lot: $ 1000 for 0.01 lots. At the risk of (1%) to 0.01 open at 0.01 Server Min Lot 0.01, when the balance of $ 1000. When Server Min Lot, equal to 0.10, the balance should be $ 10,000. First of all, try advisor strategy tester!


Options


General settings


  • Take Profit (Pips): Take Profit for the first order. When you open a second transaction system removes the take profit (making it equal to 0).

  • Stop Loss (Pips): stop loss of the first order. If Max Orders is not 1, the adviser disables stop-loss, and the system will open a new business in the same direction to average losses.

  • Fixed Lot Size: at risk equal to 0, the adviser enters the market fixed lots.

  • Risk 0.1x1000 $ € = 0.1 lot (if 0 then OFF): Risk is calculated from the available funds. 0.01 means 1%. 0.1 means 10% of the free margin.

  • Max Spread (If 0 then OFF): maximum spread.

  • Show Info Panel: Data display panel. Advisor displays advisor details of the transaction, the server and the symbol on the left side of the window.

  • Magic Number: unique magic number for the transaction advisor.

  • Order Comment: Comment to the order.


Configure multiple orders


  • Max Orders: the maximum number of open orders on the symbol. 0 - unlimited. 1 - only one order. 0-2-3-4-5 ... - several orders.

  • Min Distance in Orders (Pips): Advisor will not open other transactions to achieve the specified value even when it detects a good trading opportunity. 0 - disabled.

  • Lot Martingale Type: not martingale / lot multiplier / add to the lot.

  • Lot Multiplier: multiplier of the lot of the previous orders. It is not recommended at step Lot broker equal to 0.1.

  • Lot Addition: increase the lot size the previous orders.

  • Max Lot (If 0 then OFF): balance protection. Advisor to never open an order volume above Max Lot. When calculating Max Lot lot size is taken as the maximum value. It does not work when using the Fixed Lot Size.


closing settings


  • Profit To Close (If 0 then OFF): close all orders for the symbol when the profit specified value.

  • Loss To Close (If 0 then OFF): close all orders for the symbol when the loss of the specified value.


Secret Scalper

Related posts


  • Quadro Multi Grid Scalper


    Quadro Multi Grid Scalper We never know what the market price will do in the next second. That is why it is important to the trader a good exit strategy....


  • CAP Asian Scalper EA


    CAP Asian Scalper EA CAP Asian Scalper - Advisor is using a range breakout strategy to enter a quiet market . EA trades scalping for small deviations of...


  • Quantum Scalper


    Quantum Scalper Quantum Scalper - Advisor to the original algorithm trade breakdown price levels. It allows the use of a small stop loss, so risks and...


Next posts


  • Premium Moving Average EA

  • Rhino Scalp

  • Ultimate Z

Batman

Batman Batman Advisor is based on a very simple system that uses ZigZag indicator and breakdown strategy. Transactions are opened only whe...