Monday, December 12, 2016

Martingale

Martingale (Martingale).

This term can be seen as a game of gambling, and when trading forex around the system of transactions carried out a lot of debate and discussion, but what actually is the Martingale.

Martingale (Martingale) - money management, cash or investments in which, after the receipt of the amount of investment losses is increasing.


This strategy works is closely connected with the theory of probability, it is assumed that the trader or the player can not always enter only losing trades, luck sooner or later will still turn to face him.

If Martingale applies to trade in the casino, everything is simple - put, lost, and increased the rate again waiting for the result of the game. Then at work on forex, there are some nuances, which we'll talk further.

Firstly it should be noted that the Martingale is one of the most risky strategies in the forex and better yet use an alternate version of the so-called trade Antimartingeyl.
The essence of the Martingale strategy.

As previously mentioned, the whole strategy is based on the gradual increase in the volume of transactions, this approach allows to compensate for earlier losses derived from the profits of the last transaction. It should therefore be taken into account two main parameter is the size of the available deposit and the amount of each subsequent transaction when trading martingale.

In this case, it is not necessary to double the amount of each subsequent order is enough to increase its size so that it would overlap the previous losses.

More clearly the essence of this strategy can be understood by way of example -

The number of operations and the deposit - own funds should be allocated so that they would be enough for at least 4-5 orders.

If you have a total bill of $ 100, the first order is open at $ 10. If it losses reached $ 2, the transaction is closed, and the second order has been open to the light of previous losses, for example in the amount of $ 12.

After the second transaction and left at a loss on the $ 3 already take into account the volume of the first and second orders, then there is a third the size of the order is $ 25.

If desired, you can also use a simple trading system, using which you will increase each subsequent transaction twice. That is the first order - $ 10, the second order is $ 20, and the third 40 and so on. In this case, it will be easier to distribute the available capital.

The direction of trade - all orders are opened in different directions, it is assumed that you simply do not have guessed the first time, the direction of the trend and now you have better luck.

Closure of loss-making positions - of course, that the lower the entire deposit is not necessary, each trader sets its own level of losses. Usually it is in the region from 10 to 20 percent of the amount of operation, but do not deposit.

Martingale (Martingale) strategy is quite controversial efficiency, but perhaps for you it will bring a decent profit in the forex.

Related posts


  • Risk control


    Risk control (risk management forex). One of the most important components of forex trading is risk management, and the novice trader, sometimes can not...


  • Profitable trading system


    Profitable trading system Glad all welcome to my blog! I decided to write a short article about system trading, because explore different approaches to...


  • TRADER dies for metal Four simple


    TRADER dies for the metal? Four simple criterion for the selection of profitable signals. Probably the most the famous line from Gounod's "Faust" sounds...

Next posts


Thursday, December 8, 2016

No Dealing Desk

No Dealing Desk (NDD).

The very name of the term perfectly characterizes the concept of No Dealing Desk - trade without creating an internal site.

No Dealing Desk (NDD) - a way of trading in the forex market, which provides Bidders direct access to the interbank foreign exchange market. In this case the broker is unable to intervene in the process of trade.


This method differs significantly from the Dealing Desk for trade with the dealing desk that practiced by the majority of brokerage firms.

When NDD broker enters into agreements with a number of commercial banks, which are the main liquidity providers. The greater the number of partner banks and what they are larger, the lower the size of spreads on major currency pairs and the faster the application are executed in the currency market.

Therefore, it is important to work with the largest brokerage companies, they have the ability to provide the best trading conditions for traders.

But when trading No Dealing Desk There are two ways of trading:

Straight Through Processing - access to the foreign exchange market through intermediary banks or large financial companies that have direct access to the forex market.

Electronic Communications Network - for this option creates its own trading platform, but it is not a dealing desk, as commercial banks here are the counter-parties to broker instead of transactions and other traders. Working conditions at the ECN can sometimes differ from trading on the STP, and not always for the worse.

Whichever of the embodiments is not turned from your broker, make sure that the system on which it runs your expense categories. Even if a company advertises itself as ECN broker, it can always be working on the account and DD. This applies particularly to trade on a micro forex.

Related posts


  • Profitable trading system


    Profitable trading system Glad all welcome to my blog! I decided to write a short article about system trading, because explore different approaches to...


  • Gold Trading Forex


    Gold Trading Forex. In spite of their belonging to the precious metals gold is also the subject of intense speculation in the forex market . gold on the...


  • Auxiliary forex tools


    Auxiliary forex tools. Trade on any of the exchanges is a pretty difficult task, so why not make it a little easier for these purposes, various forex...


Next posts


Verdure Correlation Pro

Verdure Correlation Pro


introduction


Correlation - a statistical measure of the relationship between the two financial instruments. This measure helps to identify the interdependence of financial instruments / securities. The securities in the financial markets are not isolated from each other. This realization can improve your trading. Correlation, in its reasonable use, can be extremely beneficial, although many traders do not pay attention to it.


I think you will agree that on a hot day, an ice-cream will earn more than the cold. That is, the higher the temperature, the more ice cream revenue. In this case we can speak of a positive correlation between ice cream sales and the air temperature. The same principle can be applied to the financial markets.


For example, for many years the EURUSD and USDCHF almost always move in opposite directions. Let's say we get a reliable signal to sell the euro against the dollar. We can open sell order on EURUSD, and at the same time a buy order for USDCHF. If the correlation at the time of opening orders was high, it is likely that we will get profit. Correlation is used not only in the Forex market, but also in the commodity market and the futures market, and the more important for traders to understand how it works and what its benefits are.


existing problems


  • Many sites only show a correlation between the currency pairs. On them you will not know how to correlate, for example, the currency pair futures or currency pair and goods.

  • The data on these sites may differ from those provided by your broker.

  • Strategies using correlation, it is difficult to automate.

  • A correlation can not be tracked in real time in the MetaTrader 4.


The advantages of using the correlation


To successfully trade the financial markets, you need to be able to manage the risks. Understanding the correlation operating principles will help you with this. Let's look at some of the advantages of using correlation:

  • Diversification (do not put all your eggs in one basket)


You know that the EURUSD and GBPUSD almost always move in the same direction. Let's say you have predicted the dollar's weakness. Instead of having to buy 2 lots EURUSD, you can buy 1 lot and 1 lot EURUSD GBPUSD.


After entering the market came the news that caused the EUR to fall. As a result, your long position on EURUSD became unprofitable. In this situation, on GBPUSD position can insure you, as news outlets are unlikely to exactly the same effect on both pairs.


  • Hedging (reduction of risk to a minimum)

  • Maximizing opportunities for profit


You know that the USDCHF and EURUSD move in opposite directions. Let's say you open a long position on EURUSD and USDCHF short on. If EURUSD position will be profitable on USDCHF position is likely to also be profitable.


To learn more about the benefits of using the correlation, check out the "Discussion" tab.


Benefits Verdure Correlation Pro


  • You can see the correlation between any two instruments on any chart in MetaTrader 4. For example, you may want to check the correlation between AUDUSD XAUUSD and the chart EURUSD.

  • You can track changes in the correlation between any two instruments on any chart in MetaTrader 4.

  • The indicator can generate alerts, notifications or emails when crossing certain level of correlation coefficient.

  • The calculations use data supplied by your broker, so they are always accurate.

  • Correlation is displayed as a line chart, so you can always see how it changed over time. This is very useful for analysis.

  • Automation in the EA is facilitated through the use of iCustom to obtain correlation values ​​(see. Section "tracer buffer").


Interpretation of correlation values


The values ​​are calculated and displayed in the range of -100 to +100.


  • If the calculated correlation value exceeds 80 and is positive (from +80 to +100), financial instruments move in the same direction.

  • If the calculated correlation value exceeds 80 and is negative (-80 to -100), financial instruments move in opposite directions.


Assume that the calculated correlation value for EURUSD and USDCHF equal to -95. This means that for every 100 bars these currency pair moving in opposite directions 95 times. Accordingly, if you open a long position on EURUSD, while a short position on USDCHF, both of your position will be profitable with a probability of 95%.

Below is a more detailed interpretation:

  • +100 - ideal positive correlation

  • +80 - a strong positive correlation

  • +60 - moderate positive correlation

  • +40 - weak positive correlation

  • +20 - very weak (small) positive correlation

  • 0 - there is no correlation

  • -20 - very weak (low) negative correlation

  • -40 - a weak negative correlation

  • -60 - moderate negative correlation

  • -80 - a strong negative correlation

  • -100 - a perfect negative correlation


A few examples of the correlation in the Forex market


So, open the corresponding graphs and look.


  • EURUSD and USDCHF (negative correlation)

  • EURUSD and GBPUSD (positive correlation)

  • AUDUSD and NZDUSD (positive correlation)

  • Oil and USDCAD (negative correlation)

  • Oil and CADJPY (positive correlation)


Note: Remember that correlation value depends on the timeframe. If you are trading on the M15, then the correlation value should be calculated for the M15.


Input parameters


  • SymbolA - the first financial instrument

  • SymbolB - second financial instrument

  • CorPeriod - correlation period (1 to 500)

  • LineColour - the color of the indicator lines

  • UpperThreshold - upper threshold level

  • LowerThreshold - lower threshold level

  • EmailOnThresholdBreach - send an email to the email address specified in the settings MT4

  • AlertOnThresholdBreach - video and audioalert

  • NotifyOnThresholdBreach - send a push-notification to the mobile terminal


indicator buffer


Buffer 0 - correlation value


If you want to use all the advantages of the use of the correlation in the trade, you will find additional information and resources on the "Discussion".


Verdure Correlation Pro

Related posts


  • Fibonacci Swing Scalp


    Fibonacci Swing Scalp Fibonacci Swing Scalp (Fibonacci-SS) The indicator automatically sets Fibonacci line on the highs and lows of the visible part of...


  • MarketMeter


    MarketMeter It is easy to use for multiple timeframe indicator cluster analysis of these currencies. It provides a simple but at the same time effective...


  • Tesla Power Trends


    Tesla Power Trends Tesla Power Trends - it is simple and visual indicator that works with the most probable combinations and predicting space passing...


Next posts


Tuesday, December 6, 2016

Recovery Pro

Recovery Pro


It is completely automated and adaptive advisor using restoration algorithm zone (Zone Recovery Algorithm) in strategic places.


If you need help, contact me.


Features


  • 100% automated trading

  • It works with any broker

  • Responsible FIFO Privalov

  • All transactions are protected by stop-loss and take-profit

  • I am not sensitive to spreads

  • Uses built a comprehensive indicator to determine the conditions for trade

  • It can be used for scalping, swing trading and long term, depending on the settings

  • The adviser works on any pair and timeframe. The default settings are designed for couples EURUSD H1.


settings


  • Recovery Strategy - choose the strategy of the reduction zone

  • Reuse Zones - increases the number of transactions in the zone

  • Max Hedge Orders - the maximum number of hedging positions

  • Pending Order Min Space - minimum distance in pips from the purchase and sale of lines for opening pending orders

  • Max Drawdown Allowed (%) - emergency closure of all trades when it reaches the specified percentage drawdown

  • Spread in Pips - enter the spread used by your broker


  • min Bars - minimum number of bars for finding signals

  • Deviation - the maximum deflection of support and resistance levels

  • Range Filter - increasing the value of avoiding market noise

  • Min Zone Pips - the minimum interval in pips, which can be considered as a recovery zone

  • Max Zone Pips - maximum range in pips, which can be considered as a recovery zone

  • Max History Bars - the maximum number of historic bars for reading


  • auto Lots - at true used money management based on risk level. at false use fixed items

  • Risk - use a percentage to calculate the risk value of lots.

  • Manual Lots - lot size is set manually.

  • Magic Number - magic number at (-1) is set automatically

  • Trade Comment - councilor comment


requirements


  • VPS-server

  • Leverage at least 1: 200

  • Minimum balance: 1000 for standard accounts for 10 Cent accounts

  • When using low broker spreads improved results.


Recovery Pro

Video


Related posts


  • NewsSpeed


    NewsSpeed News Speed ​​Advisor written for EURUSD M1 trading on news output, changing the settings can be probyvat other currency pairs and time periods...


  • Shredder


    Shredder The strategy is based on the breakdown of support and resistance levels. As a certain distance of the price movement the robot all the time...


  • Aggresive Silence


    aggresive Silence Purpose: Automation of trade and commercial transactions in the Forex market through MetaTrader 4 trading platform (MetaQuotes Software...


Next posts


Vola Alarm Free

Vola Alarm Free


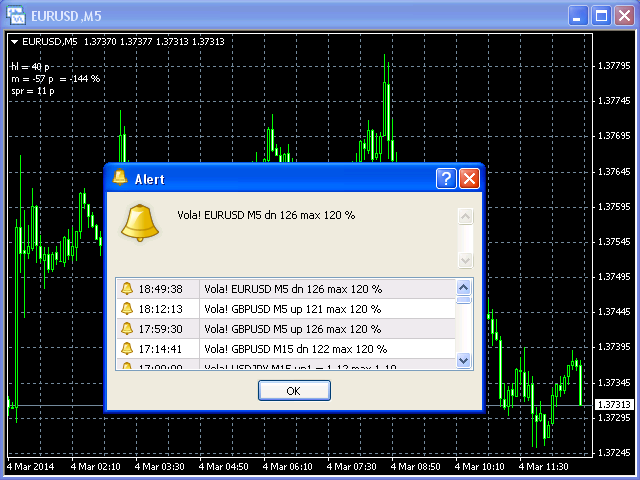
Vola Alarm shows the current value of the price movement since the opening of the bar at a percentage of the average price movement. alert is triggered when exceeding a predetermined level.


For a trader it is always important to know there is a strong movement on a pair. The product can be used in a strategy to "Installation order in the opposite direction" or "Following_The_Object strong movement." The indicator can be used on any timeframe.


The text in the graphic window shows the average maximum and minimum (Highs - Lows) in points for the last x bars.


Further, the indicator shows the value of Bid - Open of the current bar in points and percentage of the average of previous bars.


It also indicates the value spread in points.


This free version only works on EURUSD, with the default settings that are suitable for periods of M5 H1.


settings:


  • UpMax = 120: if the value of Bid - Open current bar exceeds 120% of the average value, is activated UpAlarm

  • DnMax = 120: if the value of Bid - Open current bar exceeds 120% of the average value, is activated DownAlarm

  • CalcBars = 24: Number of the last bars into account when calculating the mean value of maximum and minimum, maximum possible number - 30 bars. If the value is less than 6, the indicator takes into account the last 6 bars

  • CalcBars2Times = 6: number of bars accounted for the second time in the calculation of the average value, - this latter parameter value x bars doubled, increasing the importance of the last bars - can be set from 0 to 12 bars

  • TextPosition = 1: determining the position of the text on the chart on the following lines x - 0 to 9 lines

  • UpAlarm = True: notification inclusive; to disable, set to false

  • DnAlarm = True: notification inclusive; to disable, set to false

  • showComment = True: On the map the text in the chart window

  • showSpread = True: On the map of the current spread in the chart window 

  • SoundAlert = True: enable audible alarms

  • SendEmail = False: sending emails off. If you set the parameter to true, the title and the text of the sent email will coincide with the title and text of the pop-up notification


Vola Alarm Free

Related posts


  • Pinbar Scanner With Trend Filter


    Pinbar Scanner With Trend Filter The indicator was created by the former employee of the hedge fund. It automatically determines the most probable pin...


  • MacdPlus


    MacdPlus Indicator Moving Average Convergence Divergence (or MACD) - This trendsledyaschy momentum indicator showing the relationship between two moving...


  • Info Binary Options


    Info Binary Options The indicator displays the information on the open binary options with the nearest expiration. The information displayed from left to...


Next posts


Sunday, December 4, 2016

Ultimate Strength Meter Strong

Ultimate Strength Meter Strong VS Weak


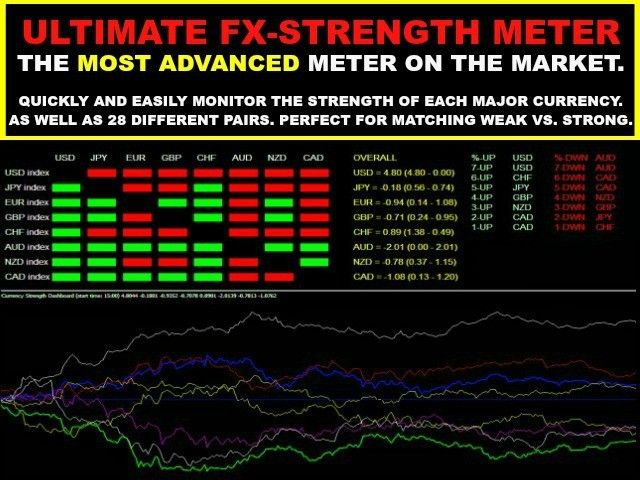
The indicator was created by a former employee of the hedge fund, and it is specifically designed to measure the strength of the 8 most popular currency pairs. This allows you to quickly choose the best pair to trade (strong versus weak), and helps you avoid those couples who are in a state of consolidation (have momentum).


  • For more information, see screenshots, and if you have any questions, please contact us. We are always happy to help.

  • Note that the version of this indicator for MetaTrader 4 has been around for more than a year, reviews / comments can be found here: https://www.mql5.com/ru/market/product/12694

  • Also, be sure to watch our short video. It includes the top 10 trading rules of hedge funds, which must know each trader.


Features


  • Easily track force on 8 major currencies and all 28 pairs. USD, EUR, JPY, GBP, CHF, AUD, NZD and CAD

  • The exact timing for the start of the data analysis. For example: Start of the trading session in New York, or after the news release.

  • Alerts crossings in real time.

  • Fully customizable colors and display currencies.

  • The construction schedule for the analysis of intersections and tracking of potential extremes.

  • Analysis of strength / weakness in percent, a direct comparison of the two currencies.


indicator settings


  • Use Alert: True = enable alerts, False = disable

  • alerts Interval: Interval in order to receive alerts intersections.

  • Start Time: Select the start time of data analysis.

  • Color Up: Color currency with a higher value.

  • Color Down: Color currency with a lower value.

  • Color None: Color blank lines.

  • Text Color: Text Color in a direct comparison.

  • Line Color: Text Color in the field of general interest.

  • Text Size: Font size for the general meaning of the text.

  • Xspace: Horizontal padding in a direct comparison.

  • Yspace: Vertical padding in a direct comparison.

  • Xoverall: Location field of common values.

  • Xconclusion: Location area currency rating.

  • Space_y: Vertical padding in the ranking of currencies.

  • Space_x: Horizontal padding in the ranking of currencies.

  • Currency Selection: Select currencies, True = show, False = do not show

  • Currency colors: The color of each currency.

  • Line Thickness: The thickness of the lines on the chart.


For best results, make sure that the "max bars" is set to no more than 50,000.
Ultimate Strength Meter Strong

Related posts


  • Bulls and Bears indicator


    Bulls and Bears indicator Bulls and Bears Indicator An indicator showing who is dominant at the moment on the market : buyers (Bulls-bulls) or sellers...


  • Dynamic RSI Pointer MT5


    Dynamic RSI Pointer MT5 Dynamic RSI Pointer designed Pointer Productions Pledge of effective work in the market - this is the best combination of...


  • Mt5 Classic PivotPoints


    Mt5 Classic PivotPoints There are various ways to configure Classic Pivot Points indicator . If you prefer to trade manually and graphics without...


Next posts


Thursday, December 1, 2016

MACD on History Deals Limited

MACD on History Deals Limited


From the report of transactions is not possible to get the value of the MACD indicator and OHLC prices which were at the time of the transaction.


The script allows you to export these values ​​in the .CSV file format for the quantitative analysis of trade results.


MACD indicator parameters are specified in the input parameters of the script. After saving the data the script displays information about the file's location.

Note: This is a limited version of MACD on History Deals. It works only on AUDCA chart.


MACD on History Deals Limited

Related posts


  • RSI on History Deals


    RSI on History Deals From the report of transactions is not possible to get the value of the indicator Relative Strength Index (RSI) and OHLC prices...


  • RSI on Realtime Deals


    RSI on Realtime Deals At the time of the transaction script records the value of the indicator Relative Strength Index (RSI) and OHLC price bars. For...


  • Bollinger Bands on Bars


    Bollinger Bands on Bars The script exports the file OHLC prices of each bar on the current graphics and numerical values ​​of Bollinger Bands (BB)...


Next posts


Batman

Batman Batman Advisor is based on a very simple system that uses ZigZag indicator and breakdown strategy. Transactions are opened only whe...