Tuesday, December 31, 2019

Batman

Batman


Batman Advisor is based on a very simple system that uses ZigZag indicator and breakdown strategy. Transactions are opened only when the actual breakdown of the market. EA opens a maximum of 2 of the transaction (1 for the purchase and sale of 1, if one of them is not closed). Expert is simple to use, requires no complicated settings. Just add it to the chart, and it will work like a clock. Advisor was developed for trade and testing for XAUUSD pair, but you can test it on other parameters by changing the appropriate settings to produce the desired results. It is recommended to test the expert on the history and on a demo account before you start a real account.


Batman Advisor uses Martingale, hedging and net. He always uses stop-loss to protect your money. Batman Expert is designed to operate on timeframe H1, is best run on XAUUSD chart. It is recommended to work with a broker who has less spread and it is desirable to use the VPS. Leverage: 1: 100 or more. If micro-account you can start using the advisor with $ 20 (spread 16-36). Recommended timeframe: H1


customers


If you need support, help, or have any other questions, write to the author a private message.


The main parameters. Do not change them if you are not sure in their actions.


Options


  • Risk: 10 (%) - the maximum risk per trade, 10% of the balance.

  • Breakeven: True - use bezubytka function.

  • Breakevenlevel: 50 - breakeven (>= Stop Level + 10). When profit reaches 50, the level of stop-loss will be moved to the opening price. At a higher value increases the risk but also the potential profit increases, too, as in this case more difficult to close the stop-loss). If the stop level of the broker 50, bezubytka level must be equal 50 + 10 = 60, however since it is often a stop level at brokers is zero, the value should be used 50.

  • Use trailing: True - the use of a trailing stop function.

  • Trailing stop: 100 - beginning trailing.

  • MaxSpread: 60 - maximum spread, the expansion of spread bolgit 60 Advisor will delete pending orders and will not allocate new.

  • Distance of top / bottom and Order Open Price: 0 (default) example 50 - indent from the top to open an order. For example, a vertex indicator ZigZag Stair 1190.00, buy stop order is placed at 1190.50 and vice versa for the sell stop order.

  • EndHour: 23 - the end of the trade. When the server time >= 23, an adviser ceases place pending orders.

  • Lotvar: 1: - avtolot, lot = free capital * Risk / Stop Loss; Lotvar = 0, lot = FixLot.

  • FixLot: 0.01 - Fixed lot = 0.01. Adjust according to your desire.

  • ZigZag: 50 - ZigZag indicator (12,5,3). The values ​​5-50, the lower, the smaller the period. EA will deal more often, but they are less accurate.


Batman

Related posts


  • Harmonic Patterns


    Harmonic Patterns Advisor, created to trade on harmonic pattern. The trade does not use any indicators and highly risky strategies like the martingale or...


  • ATS Hilo


    ATS Hilo HiLo is an abbreviation of High and Low words, EA trades pending orders, the strategy is based on the breakdown of the values ​​of High and Low;...


  • MMM Parabolic SAR


    MMM Parabolic SAR MMMStochastic advisor strategy: The robot constantly using Parabolic SAR indicator, and performs calculations to determine the price...


Next posts


Monday, December 30, 2019

Four Time Frame FX Demo

Four Time Frame FX Demo


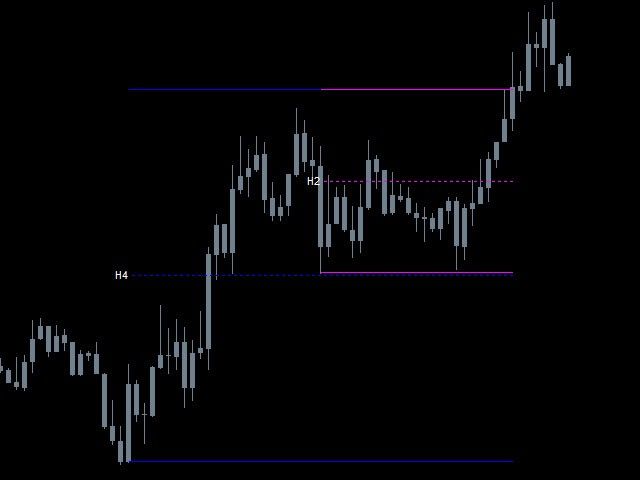
The indicator shows the high, low and mid-candles at the four time frames. Demo version: only two timeframe.


  • The combination of timeframes. It is recommended to choose H4, H2, H1, M15

  • Different colors for different timeframes and price movements.

  • Updated every minute for 0-5 seconds. 

  • For strategies based on price movement and the opening of the respective spark

  • Complemented by other indicators.


If you have ideas about how to improve this indicator, please contact us.


Four Time Frame FX Demo

Video


Related posts


  • News Trader Pro Demo MT5


    News Trader Pro Demo MT5 News Trader Pro - unique robot allows you to trade on the news of your strategy. It loads all the news from several popular...


  • Pipsburger


    Pipsburger In Pipsburger expert 's work is based on the analysis of price movements. Closing a position occurs when the appearance of the opposite...


  • Candle close timer demo


    Candle close timer demo The indicator determines the time before the end of the current candle. The indicator can show both the time before the end of...


Next posts


Friday, December 27, 2019

Transneft has received order to

Transneft has received an order to suspend the CET diesel fuel supplies to Ukraine

AK "Transneft (MCX: TRNF_p)" I received an order of the Central Energy Customs (ETC), which informs about the cancellation of the Federal Service for Technical and Export Control (FSTEC) Russian certificate issued by the Russian participants of foreign economic activity on the supply of oil products to Ukraine.

"In order to ensure the legislation on export control we are asked to stop the transportation of petroleum products in Ukraine"- he said "Interfax" President's advisor "Transneft", A spokesman Igor Demin.

He explained that the pumping diesel fuel goes in cycles. "We alternately volumes we pump in the direction of Ukraine and Belarus", - said the source.

According to him, currently pumping is carried out in the direction of Belarus. "Ukraine resumed pumping had on the night of Sunday to Monday. Now she obviously will not resume until the exporter is not new findings are obtained FSTEC", - he added.


Related posts


  • Russian oil companies will not


    Russian oil companies will not receive compensation for the decline in production Russian oil companies will not be compensated for the decrease in...


  • Rosneft has offered to form country's


    Rosneft has offered to form the country's oil reserves According to the chairman Board of Directors of "Rosneft" Alexander Nekipelova, Russia should be...


  • Video Maks Kayzer Last Days of


    Video: Maks Kayzer. The Last Days of the American Empire This major release saying that the US empire is crumbling - exactly the same as many centuries...


Next posts


Thursday, December 26, 2019

Extra money deposited in Central

Extra money deposited in the Central Bank

The Bank of Russia continued to withdraw liquidity from the financial sector. In late August, he spent the second in the past month deposit auction. In total, the regulator has drawn on its account 320 billion rubles. at rates above 10% per annum. The presence of a number of major banks' liquidity surplus suggests that the banking system has ceased to meet the needs of the economy and the tight monetary policy of the Central Bank continues to push economic growth and consumer demand.


Related posts


  • Press service of Rosneft CB shoot


    Press-service of Rosneft: CB shoot economy to not suffered Today, only the lazy I have spoken about the increase the central bank base rate. And another...


  • ECB will continue to observe predominance


    The ECB will continue to observe the predominance of downside risks - Nordea The European Central Bank during its next meeting, which will take place on...


  • Central Bank plans to make decision


    Central Bank plans to make a decision on the key interest rate insider The Central Bank plans to expand the list of insider information, data about the...


Next posts


Wednesday, December 25, 2019

Ruble fell at start of trading

The ruble fell at the start of trading on Monday amid falling oil prices

The Russian currency at the start of trading on September 12 declined in pairs with the euro and the dollar amid falling global equity markets and falling oil prices. So, the American started on the Moscow Stock Exchange with trading on the borders of 64,86-65,05 rubles per minute and added 20 cents, after rising to 65.02 rubles.

On a par with this, the euro rose by 34 kopecks to 73.1475 rubles. Dual currency basket value increased by 26.3 kopecks - up to 68.677 rubles.

Note that the black gold is getting cheaper on Monday amid published on Friday on the growth of drilling in the US data. According to the weekly report, the number increased by 7 units.


Related posts


  • Ruble fell in anticipation of


    The ruble fell in anticipation of the Central Bank meeting and amid weak activity Exporters This afternoon, the Russian Ruble reduced trades the currency...


  • Ruble is rising against dollar


    The ruble is rising against the dollar and the euro in trading today Tuesday morning Moscow Stock Exchange Russian Ruble little is gaining momentum. In...


  • Free fall of ruble 69 5 euros


    Free fall of the ruble: 69.5 euros per dollar of 63.5 On Tuesday morning, the ruble It continues to weaken after uncertain behavior on Monday. Play...


Next posts


Tuesday, December 24, 2019

Renko Charts

renko Charts


iRenkoChart indicator is designed to create a custom Renko charts. Used open format of history files, easy switching between the graphs based on the Bid and Ask quotes, quality control history, the use of experts, indicators and graphical objects for technical analysis and much more.


This indicator is based on the engine iCustomChart and is its particular implementation. ICustomChart demo version can be downloaded free of charge.
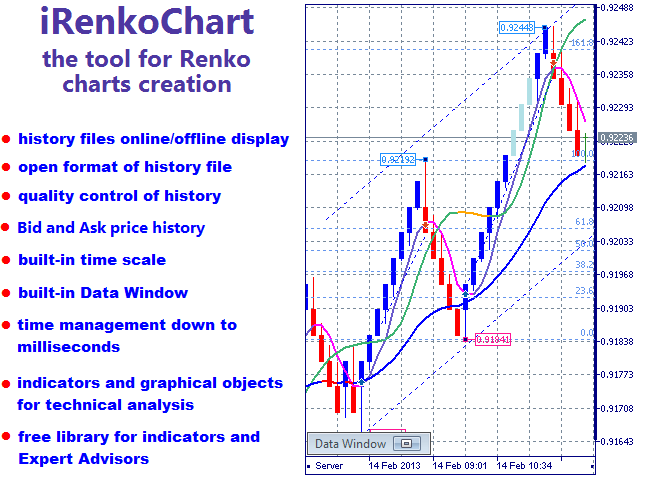
Content:


  1. Advantages and features

  2. Input parameters

  3. indicator buffers

  4. data window

  5. history files

  6. Quality control History

  7. Timeline 

  8. Graphical objects for technical analysis

  9. Indicators and experts


1. Advantages and features


  • starts and runs on any open chart window (hereinafter - the graphic substrate);

  • after downloading looks like a normal chart (see screenshot);

  • to get started is not required to have a pre-generated history files; 

  • used open format of history files;

  • You can use the data format of MetaTrader 4, MetaTrader 5;

  • easy switching between graphs based Bid or Ask quotations;

  • quality control of history (see screenshot 7);

  • full format's history, including the opening of the boxes (bars), spread, tick and stock volumes;

  • has built-in data window (DataWindow) (see Screenshot 4);

  • has built-in time scale (see screenshot 6);

  • automatic scaling of the price scale;

  • can use most of the objects from the standard set MetaTrader 5 (see screenshot 2) for technical analysis;

  • the ability to display online- or offline-graphs;

  • the ability to control the time of opening bars to the millisecond;

  • you can write on the basis of the schedule iRenkoChart own indicators and advisers using free LibCustomChart library (see screenshot 3, 8).


2. Input Parameters


  • Max bars in chart - It allows you to display a fixed number of bars (boxes) in the chart window. A zero value can display the maximum possible number of bars, up to a specified client terminal settings. When this parameter acts as a parameter similar client terminal described in the certificate. The default is 1000.

  • Size of box - range or size (boxes) bars in points from the opening price (the open) to the closing price (close). The default is 200.

  • Value of zero buffer - zero buffer value is calculated in accordance with the selected price constant.


3. Indicator buffers


Number indicator buffer
Content


0It contains selected price constant. Buffer is mainly intended for data other indicators that use the first form of the call.
1bar opening time (boxing).
2The opening price of the bar.
3The maximum price of the bar.
4The minimum price of the bar.
5The closing price of the bar.
6Color bar.
7Exchange volume.
8Tick ​​volume.
9Spread.

4. Data Window


Built-in data window looks similar to regular window in the MetaTrader 5 data, but has a few additions (Screenshot 4). The data fields are displayed in the window:


  • the top field - symbol and a parameter name. The - this bar point size (Size of box), specified in the input parameters of the indicator. When you click on this field to load a window with information about the history of the file (Screenshot 5).

  • Date - bar opening date.

  • Time - the opening of the bar.

  • Open - the opening price of the bar.

  • High - the maximum price of the bar.

  • Low - the minimum price of the bar.

  • Close - the closing price of the bar.

  • Volume - exchange volume.

  • Tick ​​Volume - tick volume.

  • Spread - Spread bars.

  • Bar - bar number; Zero bar - the last unfinished bar.


The data window has several display control buttons Graphics:


  • Shadows - button enables / disables the display of shadows on the keyboard keys duplicated "S";

  • Update - button on / off mode, the update schedule (hotkey "U");

  • Bid / Ask - button switch the display graphics based on the Bid or Ask Price (hot keys "B"And"A"Respectively);

  • Open / Close - open / close data window button in the upper right corner of the data window (hotkey "W");

  • Redraw - redrawing the graphic button is located next to the closing of the data window (hotkey "R").


Keyboard shortcuts only work with the active chart window.


5. History Files (HST-files)


To draw graphs using the open format of history files, described in the User Guide MetaTrader 4. You can get ready for Renko history file or create it yourself. You can then use iRenkoChart display for graphics.


The format of the history file is as follows. First there is the history of the file header:


struct HistoryHeader
{
  int version // version of the database
  char copyright [64]; // copyright
  char symbol [12]; // tool
  int parameter; // period or setting tool for iRenkoChart the value of the input parameter "Size of box"
  int digits; // number of digits after the decimal point in the tool
  time_t timesign; // temporary fingerprint database creation
  time_t last_sync; // the last synchronization
  int type; // type of stored history, 1 - Ask-story, 2 - Bid-story,
                        // any other value - kind of history is not defined
  int unused [12]; // for future use
};

Please note that the new "type" parameter has been added to the standard header.


base version history files MetaTrader 4 indicates "400" for MetaTrader 5 - "500". This is important because each version has its own bar data structure.


Standard representation of an array of bars, following the headline for the story version of "400" is as follows:


#pragma pack (push, 1)
struct RateInfo
{
 time_t ctm; // time in seconds
 double open; // open price of the bar
 double low; // the minimum price of the bar
 double high; // maximum bar price
 double close; // closing price bar
 double vol; // volume
};
#pragma pack (pop)

Standard representation of an array of bars for the history file version of "500" is as follows:


#pragma pack (push, 1)
struct MqlRates
{
datetime time; // bar time in seconds or milliseconds
double open; // open price
double high; // the highest price for the period
double low; // lowest price for the period
double close; // close price
long tick_volume; // tick volume
int spread; // spread
long real_volume; // exchange volume
};
#pragma pack (pop)
Note that the version of "500" bar time can be specified in seconds, and milliseconds. iRenkoChart correctly identifies both of the time format.
Important: The responsibility for the correctness of the history of the file the user.

To iRenkoChart to recognize the history of the file, it must be in the folder "katalog_dannyh_terminala \ MQL5 \ Files \ iRenkoChart \ History \ imya_brokera". File name history


  1. It must begin with the "Renko" prefix. Before prefix may be added "Ask" or "Bid", if the file is stored in the appropriate type of stories;

  2. then the tool should indicate the name of the graph is an indicator substrate is loaded (e.g., "EURUSD");

  3. should go further value of the input parameter "Size of box" indicator;

  4. and must have the extension ".hst".


An example of the file name: AskRenkoEURUSD200.hst


If the history file does not exist, it will automatically be created from the minutes of history available in the terminal. If there is, then it will be updated in accordance with a built-in algorithm.


6. Quality control History


To file stories created exclusively iRenkoChart, possible to control the quality of the story.


Any new history file is created from minute stories available in the terminal. Accordingly, there may be situations where simulated bars may differ from the bars, created online. Each questionable modeled bar graph is displayed in a lighter color than the correct bars (screenshot 7). It allows you to visually assess the quality of the story.


When initializing the indicator or switch Bid and Ask stories in the magazine appears on its quality (Screenshot 7). It is possible to estimate the percentage of good and bad bars. Note that calculation history quality only for bars shown in the chart, not to the entire history of the file.


Also taken into account in the formation of history gaps. In the graph visually default gaps are displayed as bars in gray and zero volume.


Using the indicator buffer "color bar", you can program to assess the quality of the stories of their indicators and experts. This allows you to make appropriate decisions in the implementation of a particular trading strategy.


Improve the quality of stories by iRenkoChart only online. When you receive a tick data iRenkoChart correctly calculates all parameters of bars and stores them in the history file. For example, the opening of the bars will be calculated and written down to the millisecond. If the tick data to construct a history for some time have been reported (remote connection, disable the terminal or any emergency situation), the missing history Renko will be formed based on the minute. 


7. Timeline


The time scale graphs created with iRenkoChart, usually does not coincide with the scale of the graph and the time the substrate is nonlinear. Therefore, in the indicator built own time scale for visualization (screenshot 6). Features built-in scale:


  • It looks similar to the regular time scale;

  • easily it moves vertically;

  • It has a translucent background, always visible graphics and price chart for the scale.


8. Graphical objects for technical analysis


Standard graphics objects terminal attached to the timeline graph substrate when placing in the graph window. Therefore iRenkoChart automatically rebound overlay graphics to your timeline. This makes it possible to use standard graphics for technical analysis Renko charts. Synchronization with iRenkoChart supported for the following full-time graphical objects in the MetaTrader 5:


  • lines: horizontal, vertical, trend, trend of the corner, cyclic, lines with arrows;

  • Channels: equidistant, Andrews pitchfork;

  • Fibonacci tools: line, time zones, fan, arcs, channel expansion;

  • Instruments Elliott: impulse wave corrective wave;

  • shapes: triangle, rectangle, ellipse;

  • arrow: good, bad, down, up, stop, tick, left and right price tag, the icon "Buy" and "Sell", custom arrow.


Sometimes, such as when closing the terminal, iRenkoChart stores data about the objects in a temporary file, which is located in the folder "katalog_dannyh_terminala \ MQL5 \ Files \ iRenkoChart \ Objects". all temporary files are also deleted when you delete iRenkoChart of the chart window.


9. Indicators and experts


Conventional indicators, as well as objects, follow the timeline graph substrate. To bind to the timeline indicator iRenkoChart recommended to use the free LibCustomChart library.


library functions allow you to write indicators that automatically connect to iRenkoChart (Screenshot 3), if it is loaded in the graphics window. If not loaded, these indicators will be no problem to work in a normal chart window. In addition, the library provides simplified access to Timeseries iRenkoChart.


If the library functions used in the expert, the expert, as well as the indicator will automatically use iRenkoChart data if it is already loaded in the graphics window. If iRenkoChart not loaded, the expert will work in the usual chart window and use the data.


Examples of the use of the library in the indicators and experts can be found in Code Base.


This indicator is based on the engine iCustomChart and is its particular implementation. ICustomChart demo version can be downloaded free of charge.
Renko Charts

Related posts


  • Herrick Payoff Index


    Herrick Payoff Index payment index Herrick (Herrick Payoff Index, HPI) confirms the strong trends and helps determine when they change its direction;...


  • Kagi Chart


    kagi Chart Kagi Chart indicator can display graphics "Kagi" in the indicator window. Graphics Type "Kagi" filters out unwanted noise and help identify...


  • Trajecta Smart


    Trajecta Smart Trajecta Smart - an innovative semi-automatic trading signals indicator for each pair and timeframe, which has a built-in system to...


Next posts


GM Stochastic MIDL

GM Stochastic MIDL


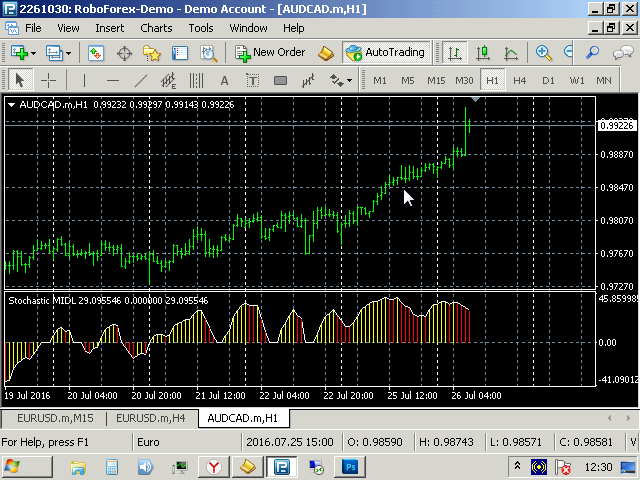
Indicator GM Stochastic MIDL It built on averaging two stochastics (7,3,4) and (20,3,7) from the level limiting. For this is the only option Lim.


Central operator indicator is


IIndBuffer [i] = ((iStochastic (NULL, 0,7,3,4, MODE_SMA, 0, MODE_MAIN, i) + iStochastic (NULL, 0,20,3,7, MODE_SMA, 0, MODE_MAIN, i)) / 2 -50)

indicator value after its implementation vary from -Y, through 0 to + Y. The white line. Indicator supplemented histogram growth indicator values ​​or descending.


Another important indicator is the operator


if (IIndBuffer [i] < Lim && IIndBuffer [i] > -Lim)
IIndBuffer [i] = 0;

Parameter Lim can be adjusted so that no part of the false movements.


The color histogram display is also configurable. Default - it is white, yellow and red. Yellow lines and a value greater than 0 - UP movement. Red lines and values ​​less than 0 - motion DOWN.


The intersection with the zero level may be a signal for the opening of the transaction in the appropriate direction.


GM Stochastic MIDL

Related posts


  • FW Stochastic MTF


    FW Stochastic MTF Stochastic indicator is the most used by traders. This version allows you to extract the maximum information without the hassle of...


  • Value Chart for MT4


    Value Chart for MT4 Value Charts (Helveg and Stendhal, 2002) - an innovative technology price display as a value, not the cost, even if the price...


  • NearLevels


    NearLevels LED displays random fractals and support / resistance levels constructed from them. Using an indicator you see a clearer picture of the market...


Next posts


Friday, December 20, 2019

In Britain MPs accused Cameron

In Britain, MPs accused Cameron of growth and the creation of an Islamic state of chaos in Libya

British Invasion led by former Prime Minister David Cameron in 2011 Libya was based on unreliable data and intelligence led to the political and economic crisis in North Africa, as well as strengthen the "Islamic State" terrorist organizations. * This is stated in the report prepared by representatives of the international affairs committee of the House of Commons.

"British policy in Libya before and after the invasion in March 2011 was based on erroneous assumptions and incomplete understanding of the country and the situation", - quotes the findings of parliamentarians The New York Times.

In this regard, the primary responsibility for the spread of chaos in the country and strengthening the IG in the region "lies with the leadership of David Cameron," the report says. In it it is also emphasized that the government could not then understand that the threat to civilians has been exaggerated, and the rebels, supported by Britain and France, were mostly Islamists.


Related posts


  • Britain Brekzit for that fought


    Britain Brekzit: for that fought for it and ran «The Guardian» quoted sources of the European Union (EU), noting that the British government will abandon...


  • Britain is determined to leave


    Britain is determined to leave the European Union Britain is determined to leave the European Union, said the representative of the British Prime...


  • Press service of Rosneft CB shoot


    Press-service of Rosneft: CB shoot economy to not suffered Today, only the lazy I have spoken about the increase the central bank base rate. And another...


Next posts


  • Ruble fell at start of trading

  • Extra money deposited in Central

  • Transneft has received order to

Deutsche Bank will begin negotiations

Deutsche Bank will begin negotiations with the US Justice Department to settle the fine

Guide Deutsche Bank intends to visit the United States for talks with the Ministry of Justice, reports Frankfurter Allegemeine Zeitung.

It states that the Ministry suspects the German bank for violations in trading securities and required to pay $ 14 billion fine.

Besides, reported, that the two sides were close to a settlement amount of the fine to $ 5.4 billion. For a month the bank US securities fell by 11.3%.


Related posts


  • OVERVIEW turnover of shares of


    OVERVIEW: The turnover of shares of open soared more than 16 billion rubles on corporate news The bank 's shares OTKRITIE Financial Corporation on Friday...


  • Forex Signals


    Forex Signals Deutsche Bank : Traders should consider selling EUR / SEK this week, according to Deutsche Bank . DB recommends selling EUR / SEK and...


  • Volkswagen Rus Bank placed 5 billion


    Volkswagen Rus Bank placed 5 billion bonds Volkswagen Bank Rus (Representative of the international concern Volkswagen Financial Services AG in Russia)...


Next posts


  • In Britain MPs accused Cameron

  • Ruble fell at start of trading

  • Extra money deposited in Central

Thursday, December 19, 2019

AnyCandleGroup

AnyCandleGroup


AnyCandleGroup displays candles H1, H4, D1 on the M15 chart.


Overview


The indicator shows the last 3 candles of any timeframe on the right side of the graph, and outputs a voice warning before the close of the candle. AnyCandleGroup prevents unnecessary clutter graphics data. The indicator is very useful if you consider the volume / spread when making trading decisions.


Capabilities


  • It displays the last 3 candles of any timeframe on the right side of the chart

  • Provides distinct voice alerts (in English) before the close of the candle (the audio files must be downloaded and installed separately)

  • Visual Alert is also used - a candle changes color before closing

  • trigger levels of alerts are configured in minutes and seconds, depending on your preference

  • The display can be switched on / off without removing it from the chart

  • The program is quite compact thanks to optimized code


installation


  1. Download AnyCandleGroup_v1.4.zip and Sounds.zip files.

  2. Unpack the ZIP-file into a temporary folder.

  3. Copy ex4-file in the folder:

    ..\ Users \ your-login-to-Windows \ AppData \ Roaming \ MetaQuotes \ Terminal \ xxx \ MQL4 \ Indicators

  4. Copy the WAV-files in the folder:

    ..\ Program Files (x86) \ MetaTrader \ sounds \


application


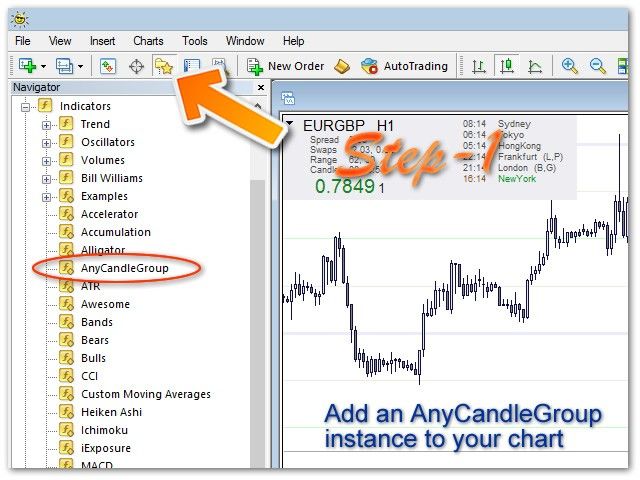
  1. Turn on the "Chart shift" in the MetaTrader toolbar.

  2. Start the AnyCandleGroup chart.

  3. Set the property value TimeFrame: AnyCandleGroup will display 3 candles specified timeframe (by default - H4).

  4. The value of the Position property should be changed only if you intend to use more than one indicator AnyCandleGroup on the same graph. Otherwise, leave the default value (7).

  5. Set the alert properties (Alarm): time and unit of measure (min = minutes; sec = second). Settings are not case sensitive, ie 5 min and 5 Min perceived equally (by default, the alert is turned off and is set to 5 minutes).

  6. Have a nice work!


Advice


  • You can add more than one copy AnyCandleGroup indicator on the same schedule. Let's say you open a graph M15, where you will also want to keep track of the last three candles with H4 charts, D1 and W1. In this case, you need to run on a schedule of three copies of the indicator. Do not forget to specify the Position property value for the second and third copies (7 leave for the first group of candles, set of 15 - second and 23 - for the third). Otherwise, the second and third spark over the first group are displayed.

  • Do not add more than three copies AnyCandleGroup one schedule (this is possible, but much sense to do so).

  • Activate alerts only one copy AnyCandleGroup indicator for a given timeframe to avoid duplicate alerts.


Example


You open a graph M15, where you will also want to keep track of the last three candles with H4 and D1 charts. In this case, you need to run two copies AnyCandleGroup on the chart and adjust them as follows:


H4 candle (AnyCandleGroup1):


  • Timeframe = H4

  • Position = 7

  • Alarm_On = true

  • AlarmStartBeforeClose = 5

  • AlarmStartMeasure = min


D1 candles (AnyCandleGroup2):


  • Timeframe = D

  • Position = 15

  • Alarm_On = false


FAQ


  1. In the "List of indicators" given that I run three copies AnyCandleGroup, but on the chart, I see only one. What is the reason?

    Position set to the same value for all copies AnyCandleGroup. Set a different value for each copy (see. Example 1).


  2. Sometimes on the chart appear unnecessary candles AnyCandleGroup. Why?

    This usually happens when your computer wakes from sleep mode and starts to update the MT4 charts. Since version 1.4, AnyCandleGroup conducts regular cleaning, which start within minutes after the resumption of MT4. You just need to wait a little longer. You can also just temporarily switch to another timeframe, and then return to the M15 (or any other that you had originally).


The indicator is free and is intended for personal use.


Good luck!


AnyCandleGroup

Related posts


  • AkenMFI


    AkenMFI AkenMFI intended for trading binary options on the timeframes M5 and M15. Oscillator AkenMFI closely linked to the indicators and AkenATR...


  • Pinbar Scanner With Trend Filter


    Pinbar Scanner With Trend Filter The indicator was created by the former employee of the hedge fund. It automatically determines the most probable pin...


  • Vola Alarm Free


    Vola Alarm Free Vola Alarm shows the current value of the price movement since the opening of the bar at a percentage of the average price movement ....


Next posts


Wednesday, December 18, 2019

MyButtons

MyButtons


Panel for manual trading. Allows you to quickly open market orders with a given risk from the deposit.


To open an order from the panel must be on the panel:


  • set the desired percentage of the risk of the deposit in the field Risk,%

  • set the distance to the desired Stop Loss in points StopLoss field, pips,

  • set ratio of Take Profit: TP Stop Loss in the field: SL.

  • press the desired button "BUY" or "SELL".


This will open a market order "BUY" or "SELL" to set StopLoss and TakeProfit. Stop Loss is triggered when Uther will be equal to the sum is a percentage of the deposit panel.


There is a possibility to close all orders instrument to which a panel. To do this, click on the button CloseSymbol.


There is a possibility to close all orders in the terminal. To do this, click on the button CloseAll.


There is a Position button if you need to move the panel according to the schedule tool.


The advisor can change the settings panel color.


MyButtons

Related posts


  • GTC Panel


    GTC Panel Commerce and dashboard for a quick trade on Forex, CFD and Futures! You can instantly send a market order to buy or sell a specified amount,...


  • Ultimate Panel Demo


    Ultimate Panel Demo Control Panel "All in one on Ultimate Panel" helps to open and manage orders according to " trade in one click" system. This is the...


  • TCS Trade Panel


    TCS Trade Panel Panel for quick and convenient operation using the basic functions of the opening and closing of orders by type, as well as the functions...


Next posts


Tuesday, December 17, 2019

Asian stock markets and investors

Asian stock markets and investors are in nervous anticipation

Asian stocks rose on Tuesday, as investors nervously await the decisions of the Fed meeting and the Bank of Japan policy that will be taken on Wednesday.

"The market is more concerned about the decisions taken by the Bank of Japan than the Fed, because it can give an unexpected surprise", - said YUTEK Miura, senior technical analyst at Mizuho Securities.

Unpleasant mood could spread to European markets.

"Today is the opening of the European markets was slightly softer after yesterday's lower oil prices compared with its intraday growth", - wrote Maykl Hyuson, senior analyst at CMC Markets, which had expected a lower digging the FTSE 100, DAX and CAC 40.

Oil has managed to gain a foothold in Venezuela to statements about the possible freezing of OPEC oil production. Indicators showed that crude oil inventories in the US rose last week.

Crude oil, Brent crude fell 0.4 percent to 45.79 dollars per barrel, while US crude oil fell 0.6 percent to 43.05 dollars.

EMini index futures and S P 500 rose 0.2 percent after major US indexes finished week turbulent bids.

Global markets are strained in recent weeks due to the Fed's intentions that remain far from unambiguous.

Following the results of the two-day meeting of the Fed plans to keep interest rates unchanged, while Janet Yellen mentioned in her speech that the central bank plans to increase the interest rate.

"There is a lot of uncertainty associated with the possible solution to the Fed," - says Dzhennifer Veyl, principal analyst for fixed income instruments U.S. Bank Wealth Management in Portland, Oregon.

Dzhennifer Veyl, like most strategists and investors expect the Fed to refrain from taking any further steps.


Related posts


  • Asian markets ended day in green


    Asian markets ended the day in green zone Today Asian optimism reigned. the MSCI Asia Pacific added, little - only 0.1%, but the main national indicators...


  • US stock markets closed mixed


    US stock markets closed mixed , Dow Jones added 0.40% The US stock market closed the trading session on Monday in different directions due to the...


  • Sentiment in Asian markets cool


    Sentiment in Asian markets cool due to weak PMI in China AT Monday declined stock prices virtually the entire Asia-Pacific the region as investors...


Next posts


  • Deutsche Bank will begin negotiations

  • In Britain MPs accused Cameron

  • Ruble fell at start of trading

Monday, December 16, 2019

Daily Economic Digest from Forex

Daily Economic Digest from Forex.ee

Daily Digest of economic Forex.ee

Keep an eye on major economic news with us

Tuesday,
September 20th

EUR/USD

current
price:
1.1188
(0.1%)

Range: at
the opening of 1.1175 Max. 1.1214 Min. 1.1168

All trend: ascending

expected
trend:
Downward

expected
volatility:
low

levels
support and resistance:
P. S. 1.1126 1.1220

main
developments:
Number
building permits issued in the US, the volume of construction new homes in
USA.

Overview: Couple
He jumped this morning, breaking through key resistance level at around
1.1200, amid aggressive selling in the dollar, fixed at the beginning of the European
session. Moreover, today, the markets have ignored the weak data from Germany Index
producer prices. Nevertheless, at the background of the lack of important data from the Eurozone today
the pair will remain under the influence of general market sentiment before the American session,
during which the United States will present data on construction.

USD/JPY

current
price:
101.74
(-2%)

Range: at
opening 101.92 Max. 102.08 Min. 101.53

All trend: down

expected
trend:
Downward

expected
volatility:
moderate

levels
support and resistance:
P. S. 101.14 102.80

main
developments:
Number
building permits issued in the US, the volume of construction new homes in
USA.

Overview:
Today the pair remains bearish tone dropping below the level of 102.00, as
chances of raising the Fed rate on Wednesday fell. Moreover, uncertainty about
decisions on the monetary policy of the Bank of Japan also limits the range of
movement of the pair. As you would expect the pair kept in a narrow trading range,
as traders remained cautious on the eve of the central bank's decision to
both sides. It is expected that the Bank of Japan and the Fed's decision will cause a wave
volatility in the market, which will bring a couple of its medium-term trading
range.

USD/CHF

current
price:
0.9775
(-0.3%)

Range: at
the opening of 0.9799 Max. 0.9812 Min. 0.9761

All trend: down

expected
trend:
Downward

expected
volatility:
moderate

levels
support and resistance:
P. S. 0.9766 0.9836

main
developments:
Number
building permits issued in the US, the volume of construction new homes in
USA.

Overview:
Today morning, the pair has been unable to remain in their shopping
range above the level of 0.9800, which kept the dollar from last Friday. Couple noted
their current lows near 0.9767 level on the back of strong pressure associated
with widespread dollar sell-marked this morning. In addition, the strengthening of
the interest of traders to less risky assets has also supported the status of Swiss asylum
Franc. Nothing important is not planned in the Swiss economic calendar on
Today, therefore, during the European session, the pair will follow the general market
mood before the release of US data on construction, which will be
presented during the American session.

NZD/USD

current
price:
0.7341
(0.7%)

Range: at
the opening of 0.7293 Max. 0.7358 Min. 0.7291

All trend: ascending

expected
trend:
Downward

expected
volatility:
moderate

levels
support and resistance:
P. S. 0.7214 0.7364

main
developments:
Number
building permits issued in the US, the volume of construction new homes in
USA.

Overview:
The pair continues to move away from its lows overnight as
Dollar remains weak in recent years against a background of decreasing the chances of
Fed rate increase in this environment. However, the upward momentum also today
limited, since the reduction in oil prices is putting pressure on couple on top.
Now all the attention shifted towards the Fed's decision on interest rates,
which determine the medium-term direction of the pair. In turn, the RBNZ also announce
his decision on Thursday at the start of the Asian session, at which participants also
the market will be closely watched.


The best conditions for the start at the STP only Forex.ee! Sign up account is now

and feel the difference with the first deal!

your Europe ECN-broker,

Forex.ee


Related posts


  • Forex ee Economic Daily Digest


    Forex.ee: Economic Daily Digest Daily Digest of economic Forex . ee Keep an eye on major economic news with us Monday, 8 August GBP / USD current price:...


  • Forex ee Economic Daily Digest


    Forex.ee: Economic Daily Digest Daily Digest of economic Forex . ee Keep an eye on major economic news with us Thursday, the 14 th of July GBP / USD...


  • Forex ee Economic Daily Digest


    Forex.ee: Economic Daily Digest Daily Digest of economic Forex . ee Keep an eye on major economic news with us Friday, July 29 USD / JPY current price:...


Next posts


  • Asian stock markets and investors

  • Deutsche Bank will begin negotiations

  • In Britain MPs accused Cameron

Friday, December 13, 2019

ExpMultiTF

ExpMultiTF


Advisor to the trades by signals Bollinger Bands indicator. When triggered the stop-loss advisor opens a position with an increased volume by a factor specified in the settings in the same direction as the previous one.


Description of the settings:


  • Magic - advisor identification number

  • Risk - risk per trade

  • K - Lot magnification factor

  • Ksl - how many times the stop loss greater take profit

  • ZagDepo - loading deposit percentage

  • CommentOrder - Comment to the order

  • spred - account spread when calculating the stop level


ExpMultiTF

Related posts


  • GRusdchf


    GRusdchf Advisor to trade the USD / CHF M5. Based on the definition of the strategy mikrotrendov, point of entry (and exit) counts based on the...


  • Twinkle


    Twinkle Twinkle - trend scalper invisible to broker a stop-loss and take- profit . Advisor does not look for the trend turns. Advisor catches strong...


  • GRaudusd


    GRaudusd Advisor to trade the AUD / USD M5. Based on the definition of the strategy mikrotrendov, point of entry (and exit) counts based on the...


Next posts


Thursday, December 12, 2019

Gazprom has opened new field on

Gazprom has opened a new field on the shelf of the Sea of ​​Okhotsk

"Gazprom (MCX: GAZP)" in the course of exploration works on perspective Kirinskoye project site "Sakhalin 3" in the Sea of ​​Okhotsk in the drilling of exploration and appraisal wells in the South Lunskoye structure produced a significant flow of gas and condensate, which indicates the opening of a new mine, the company said.

"After completion of the test wells and the analysis of geological information to the Federal Agency materials on the calculation of reserves of the new field will be passed on subsoil use for their approval and statement on the State balance of mineral resources of the Russian Federation"- said in a press release.


Related posts


  • Gazprom is building strategic


    Gazprom is building a strategic alliance with Royal Dutch Shell Executive Director of Gazprom, Alexei Miller, told the news agency Reuters, that Russian...


  • Gazprom adopted amendments to


    Gazprom adopted the amendments to the EC agreement on the OPAL Gazprom adopted changes to the European Commission in agreement on OPAL, told the deputy...


  • On Gazprom's contract by Nord


    On Gazprom's contract by Nord Stream-2 claim Technip , Allseas , Royal IHC and Saipem - newspaper To participate in the tender of "Gazprom" on the...


Next posts


  • Daily Economic Digest from Forex

  • Asian stock markets and investors

  • Deutsche Bank will begin negotiations

Wednesday, December 11, 2019

VACrocodile

VACrocodile


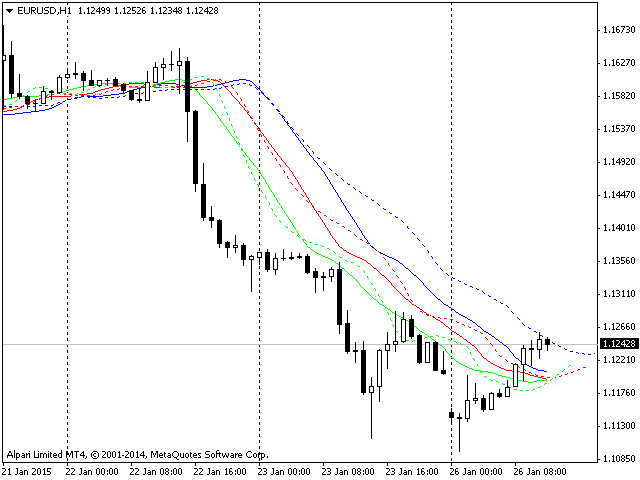
Analogue indicator "Alligator" B. Williams. But unlike the "Alligator" all moving averages are one period. Thus it was partly to get rid of the lag indicator.


In the screenshots you can see a comparison of the indicator "Alligator" (shown in dashed lines) with the default parameters and its equivalent, with a parameter for the moving averages - 15.


An indicator:


Period MA - period moving average;


MA metod - method of calculation of moving averages SMA, EMA, SSMA or LWMA.


VACrocodile

Related posts


  • DoubleMultiTimeFrameMA


    DoubleMultiTimeFrameMA Multiple timeframe indicator based on moving averages. You can adjust the parameters of the two moving averages that you see on...


  • Smart Moving Averages Indicator


    Smart Moving Averages Indicator Smart Moving Averages - exclusive indicator for MetaTrader platform. Instead of calculating the moving averages for the...


  • SqrtBands


    SqrtBands Indicator displays on the chart Bollinger bands constructed on the basis of the mean-square moving average lines. The screenshots show a...


Next posts


Tuesday, December 10, 2019

Expert Sniper

Expert Sniper


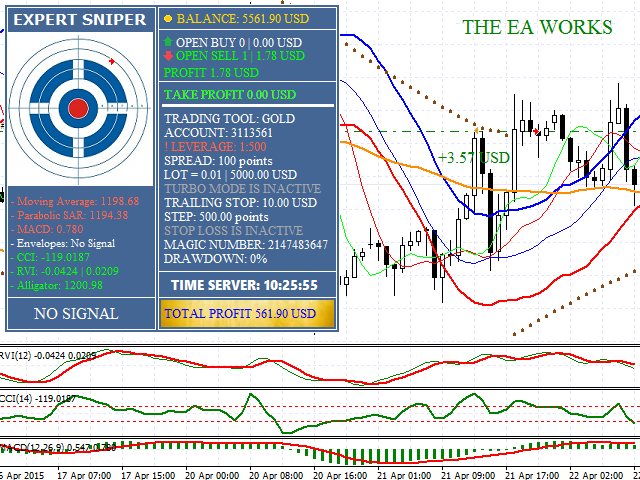
Trading Robot Sniper (Sniper). Uses the 7 trading indicators and many different mechanisms that control the trading process! All used for signal indicators known - Parabolic SAR, MACD, MA, Envelopes, CCI, RVI, Alligator! Advisor continuously analyzes and holds the key to any market situation. Designed for fully automated trading! Each order is supported by a double safety net with very smooth martingale. To reduce the risks, try not to put a high initial lot! Recommended deposit - from $ 50 on a cent, and from $ 500 - on the dollar bill. When registering an account, choose the largest Leverage (the best option 1: 1000). You need to trade on the timeframes of H1, where the best can be traced trend / the flat and kickbacks.


Trading on the live account: https://www.mql5.com/ru/signals/130353


settings


  • Fixed lot - fixed lot, if parameter auto Lot 0 registered.

  • Auto Lot (0 - disabled) - deposit to 0.01 lots. If you put 500, deposit $ 500 at the auction will be automatically 0.01. 1000 $ - 0.02, and so on ...

  • Martingale (0 - disabled) - increase the lot in the case of subsidence. It recommended from 1.6 and up ratio. If set to 0, the martingale is turned off and will be exhibited only one order.

  • Take Profit (in points) - take-profit points. Invisible to the broker.

  • Stop Loss (in points) - general stop-loss points. Invisible to the broker.

  • Turbo Mode - automatic calculation of profit growing scheme. It allows for very good money, but also increases the risks! It depends on the Take Profit option. The greater the value of the take-profit, the more turbo mode.

  • Turbo Max Profit - the maximum profit with the turbo mode. Scheme restricts the growth of profit for large drawdown. If you put 100 here, for example, that more than 100 paragraphs, the profits will not grow.

  • Trailing Stop (0 - disabled) - trailing stop. Indicated in paragraphs. 0 - disabled.

  • Trailing Step - Trailing Stop step.

  • Step for new orders - step between orders.

  • Close Orders - emergency closing orders. If you enable this option, the robot will close all of the transaction and will continue to work only after turning off this option.

  • Max Spread (0 - disabled) - maximum spread allowed for trade. 0 - disabled.

  • Magic Number - magic number.

  • Output Information - enable / disable the information on the chart.


It created a system


We always wanted to create a fully automated trading system that would manage all processes independently and would not need human control. We developed and tested a lot of strategies and decided to gather all the best mechanisms of the market, which we knew, one adviser! And there was a trading robot sniper, I was put on a real account and successfully sells it for more than a year! For trading we use minimal risks, which allows to obtain 10-15% per month with a maximum drawdown of 40%.


Today, in front of you the latest and greatest version of the adviser! The system will give you a great result if you do not aspire to greater risks! Dual mesh very well and quickly smoothes the drawdown of it out. This robot - the best and the most reliable of all that we know at the moment! We do not cheat and do the unthinkable cost of the robot available for every trader.


Tip! When the robot will give you a profit of 100% of the initial deposit - is highly recommended to take it off! Then, already at the first withdrawal, you will withdraw its investments and the robot will continue to trade on the earnings. That's what we did on the test run.


Attention! Before you buy Advisor, well test it, pick up the necessary settings for you. If the result of the EA on a demo account you are completely satisfied, you can buy. All successful trading!
Expert Sniper

Related posts


  • Life Expert


    Life Expert Overview To start trading only a small deposit. Suitable for multi-currency trading. ?Monitoring real work can be viewed here:...


  • EasyTrading Reversal Expert


    EasyTrading Reversal Expert AlwaysWin Expert represents fully automated trading robot , which opens / closes the market position on your behalf and...


  • Forex Expert Pro


    Forex Expert Pro Forex Expert Pro - multi-purpose trading robot that performs automatic trading , whereby the direction of movement of the currency pair...


Next posts


Monday, December 9, 2019

Ministry of Finance has given

The Ministry of Finance has given the green light to sweep the market by private traders

Russian Ministry of Finance Central Bank supports the proposal to limit access to trading in the stock and futures market for private investors.

This was at the Moscow Economic Forum on Friday said the deputy head of department Alexey Moiseev.

According to Moses, the protection system of private investors from the risk of losing money is not working, and access to "complex financial instruments" overly simplified.

The idea of ​​the Central Bank, which the deputy minister said, is to prevent persons with accounts of less than 400 thousand rubles to decide on the purchase of shares or bonds. Transactions for which must approve the investment advisers. The exception was a federal loan bonds issued by the Treasury (OFZ) - they can be purchased in any amount in the account.

For the market of futures and options threshold independent entrance are invited to set even higher - 1.4 million rubles.

CB intsiative actually destroy the futures market in Russia, because of the ban under the rink will get 98% of the participants, he wrote in a letter to the Central Bank in August MosBirzhi chairman Alexander Afanasyev.

The Central Bank between the object and continue to stick to their line, citing the need to protect people suffering from gambling or other forms bolezennoy craving for gambling money, ruin risks.

It promotes the idea of ​​the Bank of Russia deputy chairman Sergei Shvetsov.

The average life expectancy of active trading account with a Russian broker - 9 months, during which time the participant-layman loses all the money, argues Sweden in April.

According to him, Russian brokers with their business model yavlyaeyutsya "inquisitors". "the grinding population" countries. (Quoted by"Sheets").

According to Shvetsov, change the permissions in the direction of greater rigidity, the authorities will achieve, what to achieve "to satisfaction (of the population) was high".

Formally, the deputy chairman of the plan is to introduce the three categories of market participants - professional, skilled and unskilled (instead of two now).

Unqualified proposed to prohibit unsecured transactions and shoulder without a financial adviser.

To become qualified, the trader will need a certificate, experience in management of financial companies on the year and a minimum of 6 million rubles savings. In this case, the investor can get leverage of 1 to 3.

Professional investors will have complete freedom of action. But for this they need 150 million rubles, the presence of certificates on the domestic and international markets. the Russian market only 85 such people.


Related posts


  • Finance Ministry prepares proposals


    Finance Ministry prepares proposals on personal income tax revenues from deposits Russia's Finance Ministry does not propose to levy personal income tax...


  • Ministry of Finance proposed to


    The Ministry of Finance proposed to regulate the SWIFT system , Bloomberg and Reuters terminals The Ministry of Finance has prepared amendments to the...


  • Influence of Ministry of Finance


    The influence of the Ministry of Finance intervention on the liquidity of the banking sector will be neutral - the head of the Central Bank The influence...


Next posts


  • Gazprom has opened new field on

  • Daily Economic Digest from Forex

  • Asian stock markets and investors

Trend Expert

Trend Expert


This indicator is a trend. Its main purpose - as quickly as possible to identify the trend of prices
and as accurately as possible to follow it until it ends. current direction
prices characterized by color indicator. The basis of the indicators laid theory
Dow Jones
, according to which the prices in the financial markets move directionally,
and the upward trend is characterized by the excess of each subsequent
minimum / maximum of the previous minimum / maximum, and descending - down
each subsequent high / low in relation to the previous
maximum / minimum.


Thus, the main advantages for the trader are:


  • lack of
    any external parameters
    . The user does not need to delve into the specifics
    indicator. After a huge amount of optimization and testing processes
    We were picked up by the most appropriate indicator parameters for finding extrema
    and created three modes: scalping,
    medium-term trend and long-term
    trend.


    • scalping mode (short-term trend) must
      used by traders, trading on the M1-M5, and putting
      stop orders profit / loss of not more than 20 points (4 digits). This mode
      certain situations also pinpoints and medium-term (intraday)
      trend (>100 points). Recommendation for a short take profit only
      It suggests that in this case, the majority of transactions (>90%), a statistically
      will be profitable.

    • medium-term trend mode (intraday trend) must
      used by traders, trading on the M5-M15, and putting
      target profit / loss of 20 to 50 points (4 digits).

    • long-term trend mode must
      used to confirm trends in the H1-D1. In this
      Mode profit target >100 points (4 digits).


  • calculation function
    Extrema takes into account the volatility
    Tool that provides the most accurate determination of the trend at
    high volatility.

  • The indicator does not clutter the graph. current
    the trend is characterized by the color chart candles, respectively,
    a trader can use an additional set of other indicators.

  • The indicator is not redrawn even on the zero bar.
    If the indicator changed color (changed trend direction), then the next shift
    the trend is only possible if the stop loss is triggered. A stop order
    calculated according to a specific algorithm that takes into account the current volatility.

  • Automatically built equidistant channel, which shows the current direction of trends and best approximates
    the current trend. The channel is always directed only in the direction of the trend, and can be used to determine points
    opening / closing position.

  • For the purposes of risk management, the chart always shows
    stop loss line
    . The indicator always shows a definite
    signal (BUY or SELL), trend change is possible only when the level stop loss.

  • The indicator has a very flexible settings visualization.


This indicator is the result of more than five years' programming experience and practical trading on the currency market. The idea forming the basis of this indicator, in practice it has proved its effectiveness and efficiency.


Trend Expert

Related posts


  • TSO Currency Trend Aggregator MT5


    TSO Currency Trend Aggregator MT5 Indicator TSO Currency Trend Aggregator job compares the behavior of currency pairs 7. It allows you to instantly...


  • FxGlow Force Factor MT5


    FxGlow Force Factor MT5 This unique indicator determines the trend of using a complex system of filters. Applied calculation method that follows the...


  • EasyTrading Reversal Expert


    EasyTrading Reversal Expert AlwaysWin Expert represents fully automated trading robot , which opens / closes the market position on your behalf and...


Next posts


Friday, December 6, 2019

Figure of silence What is not

Figure of silence. What is not Putin said in his message to the Federal Assembly

In his address to the Federal Assembly Vladimir Putin commented on the situation in the economy, fighting corruption and coming changes in the tax system. However, there were important topics that regularly attracted the attention of the public and the media, but the head of state in his speech did not touch. Forbes collected these topics in one gallery.


Related posts


  • Fed Chairman Janet Yellen is not


    Fed Chairman Janet Yellen is not talked about monetary policy in the speech on Wednesday Yesterday, as It is known to be chairman of the Federal Janet...


  • Church began work on creation


    Church began work on the creation of orthodox banking system already created a working group to consider technical capabilities and parameters the new...


  • European Union is preparing lawsuit


    The European Union is preparing a lawsuit against the US in the WTO EU countries have started preparing the claim to the World Trade Organization against...


Next posts


  • Ministry of Finance has given

  • Gazprom has opened new field on

  • Daily Economic Digest from Forex

Thursday, December 5, 2019

US index futures point to steady

US index futures point to a steady opening session on Wall Street

Futures on Wall Street on Tuesday, indexes indicate a stable opening of the next day after optimistic data on activity in the US service sector pushed the Dow Jones Industrial Average to a record high at the time of closing.

Futures on the Dow Jones Industrial Average fell by 2 points, or 0.01%, futures on S P 500 unchanged, while the Nasdaq 100 futures increased by 2.12 points, or 0.05%.

At 10:00 ET US is to release data on factory orders for October


Related posts


  • Oil prices have strengthened growth


    Oil prices have strengthened growth following the publication of a decline in US inventories data Oil prices have increased growth after the publication...


  • Big Three Wall Street recovers


    Big Three Wall Street recovers losses trading session Wednesday ended on Wall Street steady growth . DJIA added 1.33%; 500 S P makes the fastest growth...


  • Dollar has appreciated at time


    The dollar has appreciated at the time , although the reports did not coincide with the predictions employers was added 173 thousand. jobs in August (the...


Next posts


  • Figure of silence What is not

  • Ministry of Finance has given

  • Gazprom has opened new field on

Tuesday, December 3, 2019

SR Key Breakout and Jump Levels

SR Key Breakout and Jump Levels


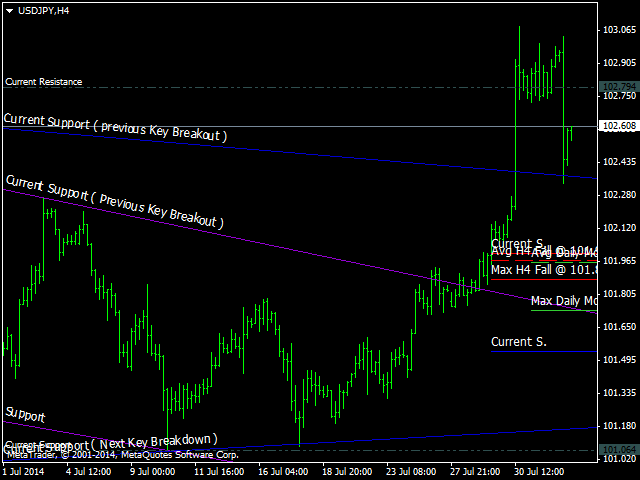
Key Breakout and Jump / Fall levels. Not late. It is not redrawn.


  1. The trend line is used to detect the pattern for the model "triangle", support and resistance lines, and how to break the line up or down. 

  2. Trend lines are formed before the pair reached its price. The line is not redrawn. 

  3. In each line there is a description, for example, Support, Current-Support as key breakout down, and Current-Resistance as a key breakout up. 

  4. Each punched line becomes the new level of support or resistance. Changes occur automatically in real time. 

  5. Nearest to the horizontal trendline support / resistance lines are the strongest. 


When a person is under pressure, and sometimes even under normal circumstances, you can forget about something trivial, but in fact important. Here, at the outset formed channel showing breakdowns. And when the price is in a period of consolidation, with lateral movement, people often forget about the triangle patterns. Ultimately, the come the breakdown of their surprise.


This indicator automatically draws the channel and pattern, and the breakdown of drawing the upper and lower limits. Scalpers and day traders mmogut use these indicators on H1 and H4 charts. At a higher timeframes indicator can be used for Swing-trading.


Use this indicator to mind, do not give up on a good MM, immediately lock the position when the relevant conditions. Because the market is not so simple. Better define all the signs and all the carefully considered before making trading decisions. Use the channel and signs of a breakdown, as well as the extent to which the price will bounce during high volatility. You no longer need to build the channels themselves, this indicator does everything for you.


SR Key Breakout and Jump Levels

Related posts


  • TR Breakout Patterns Scanner


    TR Breakout Patterns Scanner This price action indicator automates detection the breakdown of the trend patterns and patterns re-breakdown testing , and...


  • Fifth dimension MT4


    Fifth dimension MT4 Indicator searches and marked on the chart trading signals "Fifth Dimension". DETAILED DESCRIPTION graphical models forming trade...


  • Levels of Volatility


    The Levels of Volatility The indicator indicates support / resistance levels based on the volatility of the currency for a selected period (the number of...


Next posts


  • VACrocodile

  • AnyCandleGroup

  • GM Stochastic MIDL

Bollinger on Bollinger Bands

Bollinger on Bollinger Bands (book)

Bollinger on Bollinger BandsIn the book "Bollinger on Bollinger Bands" Dzhon Bollindzher tells about the history of their own trading tool - Bollinger Bands, which secured him a place in the history of the investment analysis.
I could not find the investment analysis system in the 1970s Dzhon Bollindzher beginner market, right in his belief that all market events exist only in relation to each other, and that there are no absolutes do not exist. So he created his own. This approach - rational analysis!
And now, in his book "Bollinger on Bollinger Bands" Dzhon Bollindzher tells about the market conditions that led to his initial discovery, and encourages readers to see the inside story of the development and debugging of Bollinger Bands.
The book will present the structure of the relative solutions, built on the basis of rational analysis and Bollinger Bands - unusually powerful combination of technical and fundamental analysis, which gives an answer to the question of whether the price is too high or too low for virtually any security or market environment.
By understanding how to incorporate Bollinger techniques into their own investment strategy, investors will significantly improve their ability to ignore the often costly emotions and be able to make rational decisions, based both on the facts and on the basic market environment.

https://vk.com/doc-106483972_437018685


Related posts


  • To hedge market you can use futures


    To hedge the market , you can use futures and options novice traders often think, what is needed are financial instruments such as futures Options. Can I...


  • AUDUSD after performance of heads


    AUD / USD: after the performance of heads of the RBA and the Fed TRADING RECOMMENDATIONS today the speech of the Reserve Bank of Australia Glenn Stevens...


  • German stock market closed mixed


    German stock market closed mixed , DAX 30 added 0.26% © Reuters. German stock market closed mixed , DAX 30 added 0.26% Investing.com - German stock...


Next posts


  • US index futures point to steady

  • Figure of silence What is not

  • Ministry of Finance has given

Monday, December 2, 2019

TimeFramer

TimeFramer


This simple tool adds the designation timeframe graphic object (such as trend line, triangle or Fibonacci) in the text box corresponding to the object. When you install the cursor over the object you can see, it is set in what timeframe.


application


  • Start at the appropriate graph indicator

  • Draw the object, click on it once. The time frame will be added to its text field.


Note: If the object already contains some text, the time frame will not be displayed.


  • To know the time frame in which the object is, just hover your mouse over (even if the object is selected) was created.


The indicator has no parameters.


You can add it to any number of charts.


TimeFramer

Video


Related posts


  • Trend direction


    Trend direction tunable indicator trend direction , based on the intersection of two moving averages (MA). The indicator allows to analyze the moving...


  • Slide Trend


    Slide Trend Slide Trend - A simple indicator showing the trend and allows you to quickly and easily move between schedules. It is designed for fast...


  • Tipu Panel


    Tipu Panel Tipu Panel displays trends / signals at selected timeframes and running indicators (separately installed). For greater efficiency it is...


Next posts


Batman

Batman Batman Advisor is based on a very simple system that uses ZigZag indicator and breakdown strategy. Transactions are opened only whe...