NewBbandsMT4
Probably every trader known indicator Bollinger Bands (Bollinger Bands). This indicator is similar to moving average envelopes, but based on the current market volatility. The author of this indicator - Dzhon Bollindzher. Bollinger Bands provide a statistical estimate of how far can leave short-term movement before it will return to a major trend.
Are the following characteristics of the indicator Bollinger Bands, which are worth paying attention to:
- The movement of the price chart with the outer side of the strip may signal a continuation of the trend;
- Price movement, begun by one of the band boundaries, strives to achieve the opposite band;
- Abrupt price fluctuations typically occur after the band corresponding to reduce volatility. Experience shows that strong price movements occurred after narrowing bands approximately the same level.
- Bollinger bands to successfully play the role of support and resistance lines. It is believed that 95% of the price should be formed within the price corridor, and 5% - to go beyond these lines. the price breaks out of the narrow corridor Bollinger band up - it is a signal to buy, down - a signal to sell.
Dzhon Bollindzher recommends the following deviations:
| 10 | 1.9 |
| 20 | 2.0 |
| 50 | 2.1 |
In addition, it also indicates the following:
"For the calculation of periods of less than 10 or more than 50 it is more appropriate to change the frequency bars. For example, if you require the billing period less than 10 days, it may be better to switch to hourly bars than trying to further compress the settlement period."
It was a very succinct description of the Bollinger Bands. Now let us turn to the indicator NewBbandsMT4. What is the difference of this indicator from the usual Bollinger Bands? In the first place, this indicator can be used as a standard Bollinger Bands, and its modified version. The second difference is that the modified version, due to its gradation is able to form a more accurate support and resistance levels. Another feature - a clear formation of the corridors, the output of which is regarded as a signal to buy or sell. However, the width of the corridor is better to filter. For example, using ATR indicator (period 200). If the width of the corridor is less than or equal to the 2 * ATR, then the probability of a strong exit this corridor is high. If on the contrary, more than 2 * ATR, the output is likely to be weak. Here it turns out that the usual Bollinger Bands indicator often changes its value. This changes the width of the corridor from bar to bar, even in the flat period. A modified version of this deficiency deprived. If formed a sideways trend, the width of the corridor is stable.
Another difference of the indicator from a standard - is the ability to display the schedule of the indicator value higher timeframes.
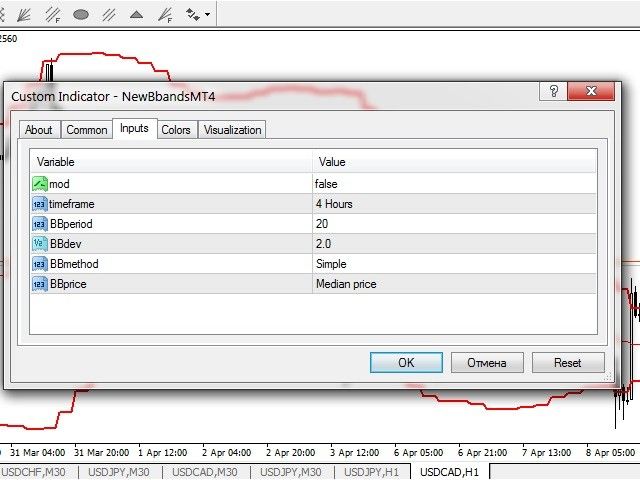
settings
- mod: False - a standard indicator Bollinger Bands, true - it is used a modified version;
- timeframe - Select a timeframe for the construction of the indicator;
- BBperiod - indicator period;
- BBdev - a factor that indicates how many standard deviations used in calculating the indicator;
- BBmethod - smoothing method;
- BBprice - prices of the type used in the calculation of the indicator.
Related posts
DreamCatcher The indicator shows a favorable entry points into the market by the arrows. Can be used for pipsing on small periods, and for the long-term...
Vidente Advantage: The others do not know (yet). Indicator Vidente for MetaTrader - tool to determine the price trend . For beginners it is a great help...
Alpha Trend Alpha Trend - This trend indicator for MT4 platform, developed by a group of professional traders. Indicator Alpha Trend It is the most...

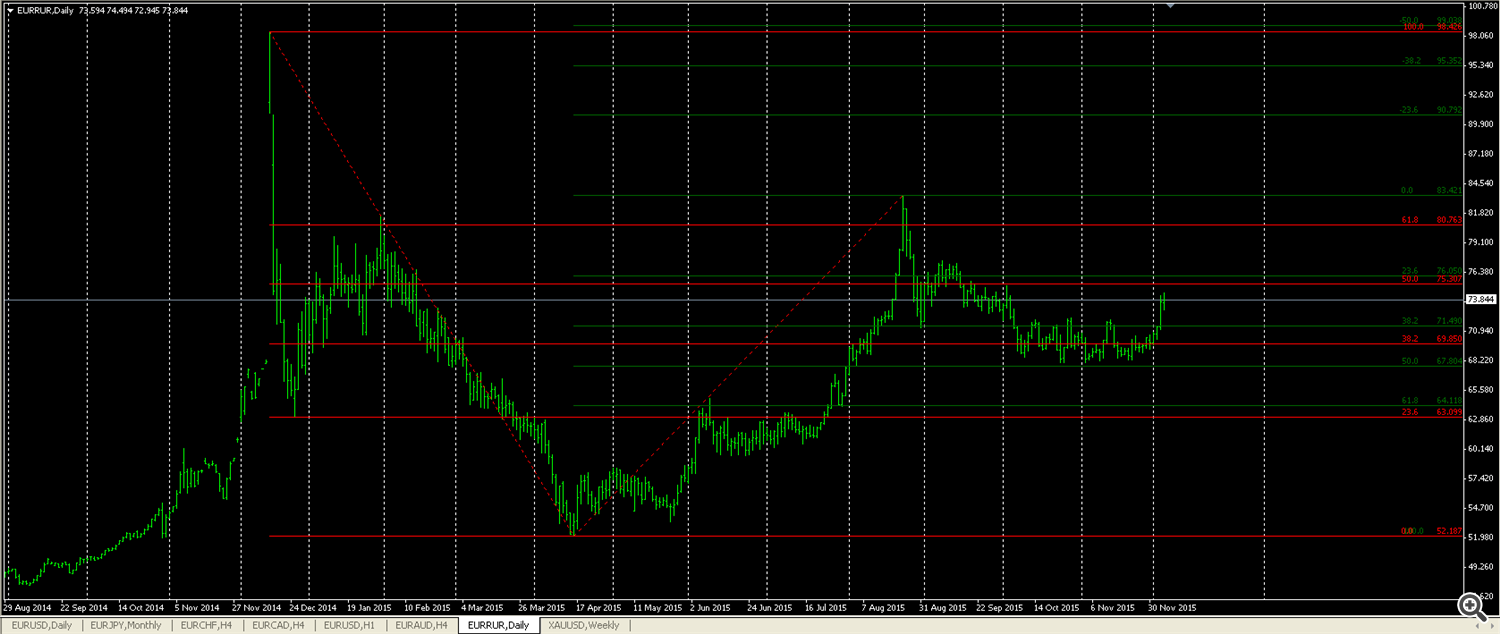
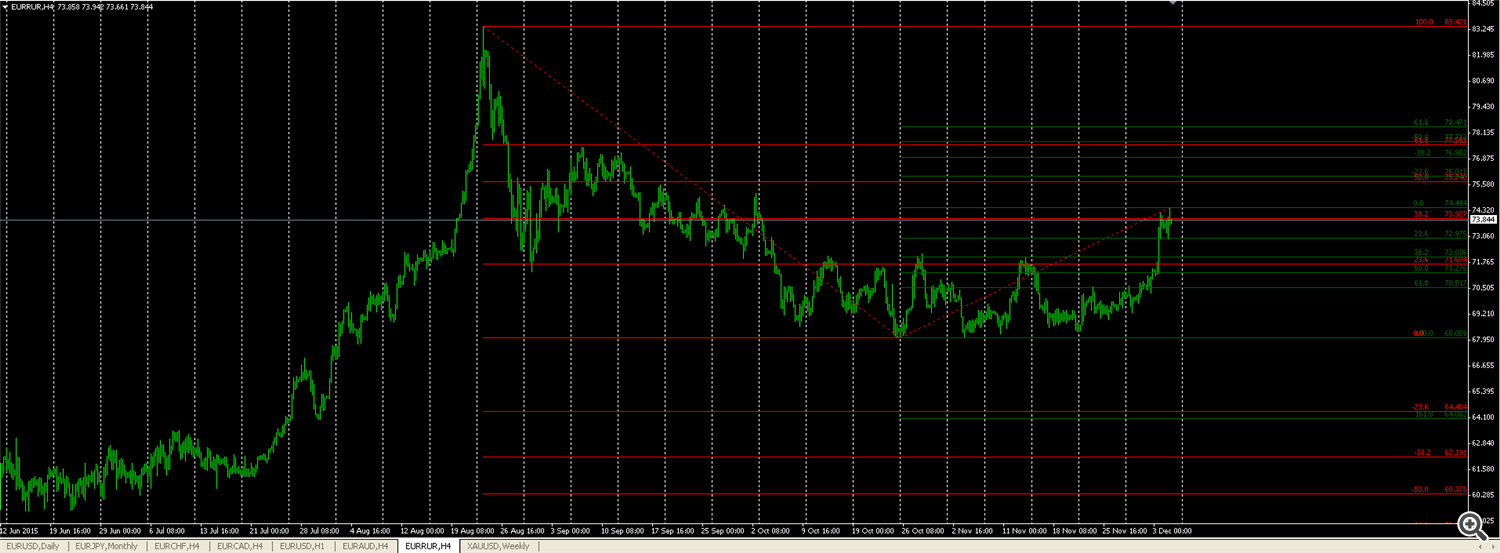
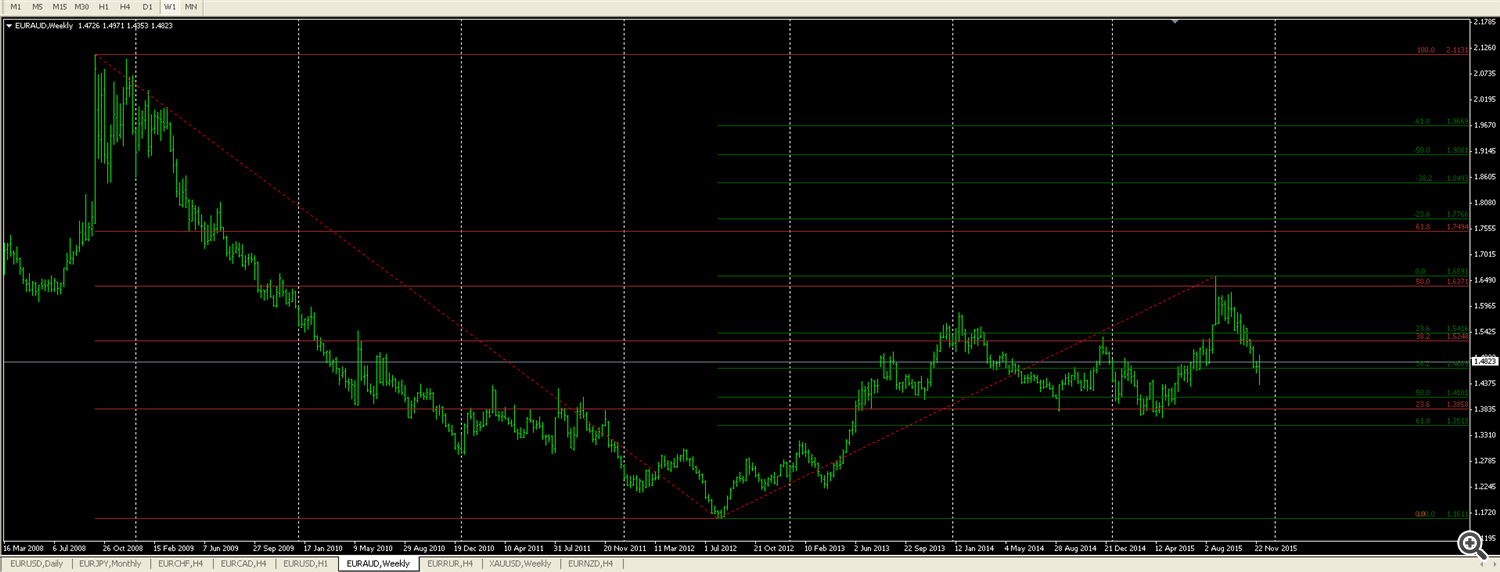 Input for sales was the price of 1.6371 with a risk of higher prices 1.7494
 AT
AT On
On gone
gone