Tuesday, October 31, 2017

StockTime MT4

StockTime MT4


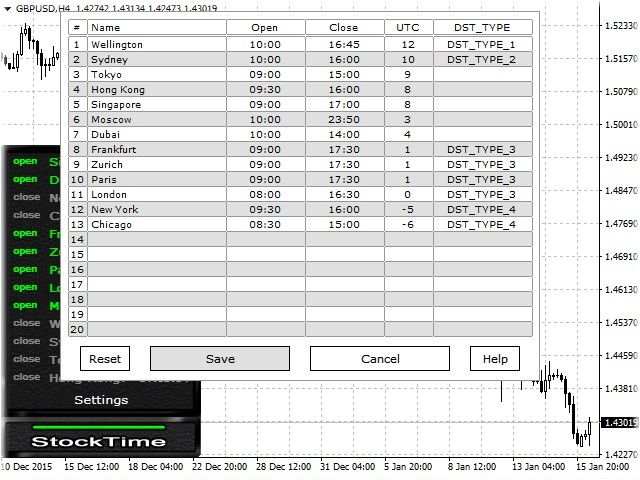
The utility displays the time of the major stock exchanges.


StockTime automatically adjusts the time zone and the summer / winter time.


It has 2 built-in themes: light and dark. It is possible to push the button «StockTime» «fold" tool to save space on the chart. The indicator has an editable list of trading platforms, which can be edited as needed.


settings:


Clicking on the button «StockTime» - expand / collapse utility.


  1. Skin - list allows you to change the theme.

  2. Allow Alerts - allow the sound notification.

  3. The name of the sound file - the name of the sound file. The file must be located:


  • In the catalog ClientTerminal_folder \ Sounds or subdirectory.

  • In the catalog katalog_dannyh_terminala \ MQL5 \ Files or subdirectory.


Only play audio files in WAV format.


If the field is empty - play standard audio utility.


On weekends and holidays StockTime days will run in demo mode.


StockTime MT4

Video


Related posts


  • TCS Trade Panel


    TCS Trade Panel Panel for quick and convenient operation using the basic functions of the opening and closing of orders by type, as well as the functions...


  • Trade History Statistics


    Trade History Statistics Trade History Statistics It allows you a convenient way to view statistics of your trade in different periods of time For proper...


  • Aero Trailed


    Aero Trailed The program itself does not open warrant. (In test mode opens a random order to render the work) This tool is designed to help traders...


Next posts


  • Expert Non Loss

  • Ultimate Panel Demo

  • MQLTA Take Screenshot

Monday, October 30, 2017

Ruble has fallen sharply against

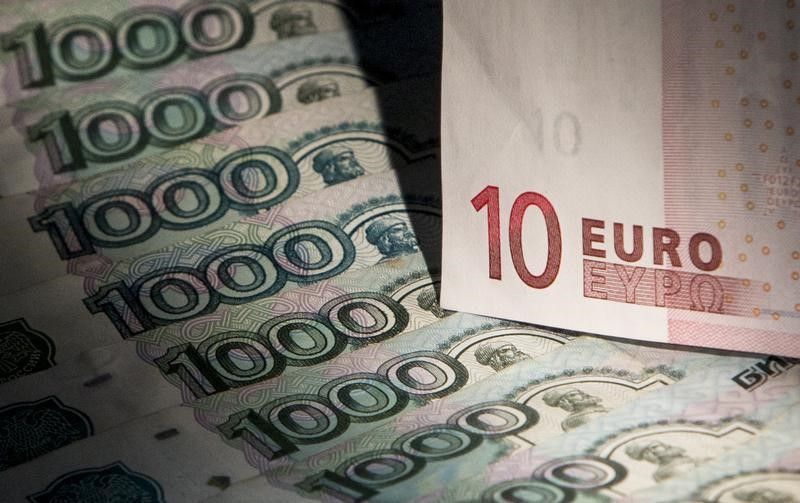
The ruble has fallen sharply against the euro remains stable against the dollar

Ruble has fallen sharply against

The ruble opened trading on the Moscow stock exchange without significant changes in the dollar and a significant reduction in the euro, which is explained by a sharp appreciation of the single European currency on the world market after ECB President Mario Draghi hinted at the possibility of normalization of the ECB's policies. Support to the ruble may have a demand on the part of Russian companies in the last phase of the tax period.

At the same time the pressure on the Russian market had on oil prices, which are now gone slightly down as a result of an unexpected increase in US inventory levels.

As of 11:00 GMT the dollar-ruble exchange rate was 59.50 (+ 0.02%), while the euro rate against the ruble rose to 67.70 (+ 1.7%). Brent crude oil at this time was estimated at about $ 46.70 per barrel.

On the eve of the Russian currency fell against the dollar by 1.2%, despite the positive dynamics of the oil market.

"Yesterday the speaker confirmed our medium-term view of the limitations of the ruble strengthening the capacity even with an increase in oil prices. As part of the streams in the morning the market was felt there was a demand for the currency, the nature of which has been difficult to identify "? said Dmitry Polevoy from ING Bank.

Russian stock indexes traded in the red in the trend with the world. Investors doubt that Donald Trump promised reform program and growth stimulation can be implemented in the near future. The US Senate postponed the enactment of health care reform.

"Mixed outlook for the global economy, combined with increased tensions in relations between Russia and the United States set a negative tone for the opening of the market today," - says Mark Bradford, an analyst at IG BCS.

The US believes that the situation in Syria has deteriorated due to the fact that Russia has come to the aid of the government of Bashar al-Assad, said State Department spokesman Heather Nauert.


Related posts


  • Ruble fell in anticipation of


    The ruble fell in anticipation of the Central Bank meeting and amid weak activity Exporters This afternoon, the Russian Ruble reduced trades the currency...


  • Free fall of ruble 69 5 euros


    Free fall of the ruble: 69.5 euros per dollar of 63.5 On Tuesday morning, the ruble It continues to weaken after uncertain behavior on Monday. Play...


  • Strengthening of ruble creates


    Strengthening of the ruble creates conditions to reduce the key rate CBR? Bloomberg The ruble rose to its highest level in three months against the...


Next posts


  • US trading closed in green zone

  • If Iran will remove sanctions

  • Wall Street indexes rose after

Friday, October 27, 2017

Why is American dream can fall

Why is the American dream can fall apart

Jeremy Olshem, MarketWatch The portal editor, I read a study about what the poor children in America are different from the rich and how it has the potential to affect the country's economy. His calculations look very touching and funny at the background of the amazing highs "Star boys and girls"That suddenly occur in Russia. All we regularly see some spectacular career children do Upper Middle Class and how they differ from the usual Vovochek in ordinary Russian schools. Let us celebrate this sweet, kind and fluffy appeal to American equality and fraternity, based on economic assumptions.


"AT
"The Adventures of Huckleberry Finn" young
hero laments the efforts of its reception
mother "civilize it," especially for
dining table, where he complains
what each dish is prepared and served
separately. "In the belly of the differences still
will not "- says Finn. - "All of
all mixed and digested, and deeds
will get better. "


I
thought of this story, read the study
Roberta Putnema "Our Children", a shocking
the study of how disastrously
It is increasing the gap between rich and poor
children. America would like to think of myself
as a "barrel with all sorts of things," his
kind of democratic stew Huck Finn.
But, as Putnam shows American
society is becoming more and more like
dishes on his foster mother, where each
the dish is cooked separately and served
on different plates.


Families
from the high strata of society separated
from the other, not only socially, and and
geographically: they settle in the wealthy
suburbs and teach children in some
schools, from their serious separiruyas
less fortunate colleagues. As a result, children from
families with lower income can not only
faced with great difficulties, but
and have no positive examples. They
effectively cut off from the majority
opportunities.


Putnam
says: "If you're young and in America
poor, then you really are isolated
and do not have close ties almost
with anyone you cook in its own juices.
You do not know anything about the potential
your talents or skills of the species
Now demanded by society. You
not have the skills to communicate with people from
other social circles. "


Analysis
Putnam shows how the structure of the family,
the practice of bringing up children, their education,
habits and health status correlate
with possibilities. So, the correlation
This decreases the stronger, the poorer
a family. It turns out that very often the poor
families are still incomplete: social
installation is very different from
the so-called middle class.


Also
educated and affluent parents
spend more time with their children. because of
lack of support and positive
example, perhaps poor children with the most
high marks are less likely to
higher education in college,
than rich kids with Flysiesta.Pl
estimates. Baby
obesity is almost completely stamped out in
families secured, but continues
grow among low-income citizens.


Putnam
He accuses wealthy parents is
that they want the best for their children.
"Maybe you'll be surprised at
his book, I did not appoint villains "-
he said. But
he concludes, and warns that
to help improve children's prospects
from poor families, it is not only
moral obligation of the rich people in America.
They will get from this direct economic
benefit. The US economy would have been powerful
impulse, if tears were patched.
"We can not continue to live in our
crystal castles and in some
plates, otherwise it take on a momentum unpleasant
consequences ", - he says.


Maybe,
as I suggested at the dinner table Huck
Finn, when we mix things up and break
physical and cultural class
partitions, "things will get better."

Jeremy Olshem for portal MarketWatch. Translation - Anomalia.


Related posts


  • Number of vacancies to 5 8 million


    the number of vacancies to 5.8 million increased in the US: it is both good and bad In America recently We counted a record number of open vacancies in...


  • As far as China is excited about


    As far as China is excited about the prospect Brekzita? All the light of China's business was sure he was ready for any EU referendum result. However,...


  • Free fall of ruble 69 5 euros


    Free fall of the ruble: 69.5 euros per dollar of 63.5 On Tuesday morning, the ruble It continues to weaken after uncertain behavior on Monday. Play...


Next posts


  • Ruble has fallen sharply against

  • US trading closed in green zone

  • If Iran will remove sanctions

Thursday, October 26, 2017

Bollinger Histogram

Bollinger Histogram


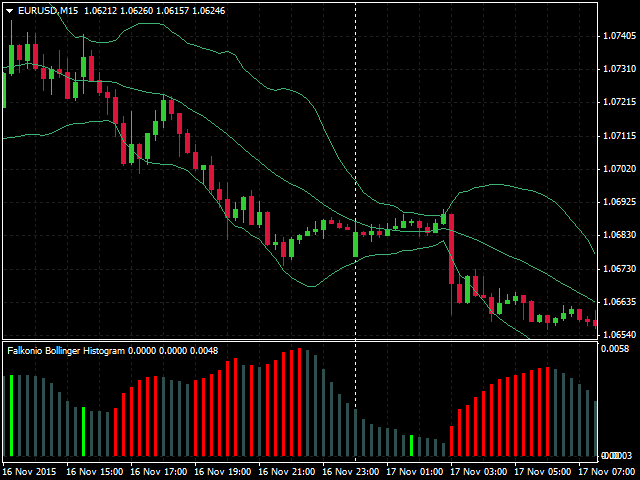
Histogram of the difference of the upper and lower level lines Bollinger. Height Histogram range extension means for trending portion narrowing range reduction means during the correction. Histogram color: the fate of the trend on the increase, a trend plots for a fall and corrections areas are marked with different colors. Like other trend indicators, it gives clear signals, but with a delay.


There is information about the function of the color change (or the end of a trend). You can activate Push-, Alert- or Mail-notification. You can select whether only the notification of the closure of the bar or on the current situation.


indicator settings


  • Bands Period - period simple moving average. You can not specify below 2.

  • Bands Deviation - standard deviation of a simple moving average. You can not specify less than 1.00

  • Applied Price - the prices at which the moving average is based. Drop-down list.

  • Must it use the Push Notification? - whether to use Push-notifications to MetaQuotes ID?


    • true - use (in the terminal settings must specify MetaQuotes ID)

    • false - do not use


  • Must it use the Alert Notification? - whether to use the Alert-notification?


    • true - use (a message will be displayed followed by the sound)

    • false - do not use


  • Must it use the Mail Notification? - whether to use the E-Mail notifications?


    • true - use (you must fill in the relevant paragraph of the terminal settings)

    • false - do not use


  • Price for notification - on what bar to take the information for the notifications


    • Current - of the current bar

    • Close - on closing of the previous bar


  • Pause for notifications (sec) - pause between notifications using the current bar. Specified in seconds. You can not specify less than 10 seconds. When using the current bar situation can often change the color of the bar. In order not to send too many messages and not to exceed the limit, the restriction introduced in the setup.


Bollinger Histogram

Related posts


  • MicroTrendCheckerMT4


    MicroTrendCheckerMT4 Signal MicroTrendChecker LED monitors on the terminal price chart of the currency pair. Yet the trend level returns to the value of...


  • Moving Average fullshift


    Moving Average fullshift Moving average , which can be shifted not only to the right / to the left, but also up / down. It is also possible to select the...


  • MA Statistics


    MA Statistics The indicator calculates certain statistical data relating to the moving average (MA) and price . Statistics associated with points...


Next posts


  • MA Swing High Single Time Frame

  • Analyzer PRO

  • Sensh RD

Wednesday, October 25, 2017

Silver or stagnation over

Silver or stagnation over


monthly graph
Silver or stagnation over


March finished in silver in a symbolic plus (+ 0.37% to 16.6615) and "April" this week went to a minus. The revival of sommodities after a weak March employment report (released on April 3) in the US was replaced by retrograde motion as soon as the dollar on Wednesday, April 8 became stronger. Strengthening dollar and falling metals began even before the release of the Fed meeting minutes of March 18, but after the release of data on the unexpected fall in industrial orders in Germany - fall is the second consecutive month. Again the Greek theme featured in media headlines. Minutes of the Fed later confirmed the bullish move in the dollar, because there were some people among the members of the Open Market (FOMC) Committee, which called for a rate hike in June. Although the market is still waiting for an increase in US interest rates in September, the desire to buy dollars won. Downward movement in precious metals may also be fueled by a sharp decline in oil prices after data record growth in US oil inventories.
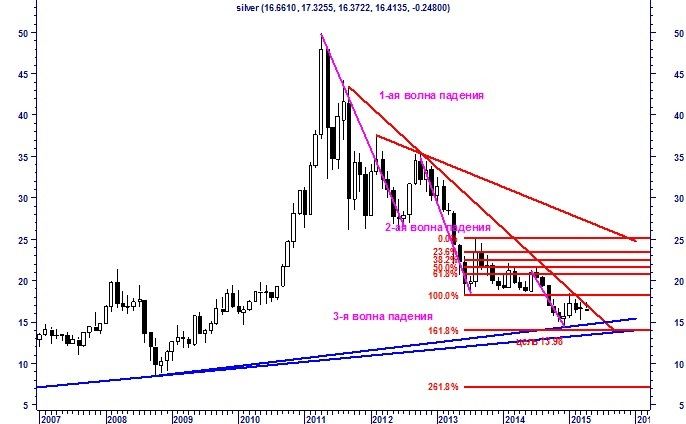
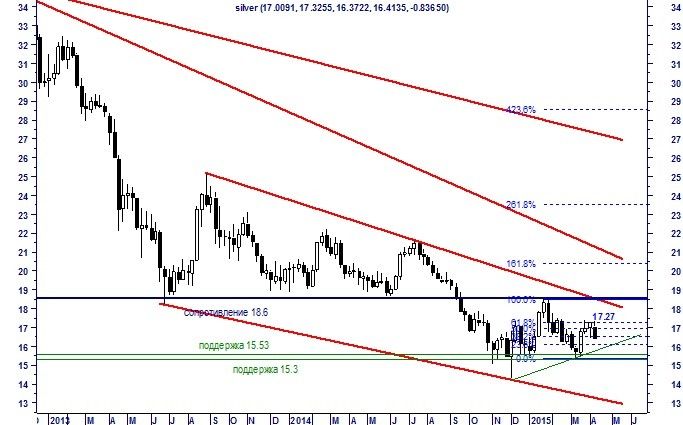
On the monthly chart of silver is observed massive picture of the growing interest in silver until 2011. and loss of interest in it since 2011. In the fall of 2011 after. there are three waves, which successively decrease in size. Currently, the line of aggressive reduction highs tends to the intersection with the long-term rising support line near $ 14 an ounce. At monthly chart current sample level is allocated for a local minimum 18.23. The first goal of breaking Fibonacci - 13.98 - still not achieved. silver price "managed" to run only until December 14.2885 minimum. The issue of testing this minimum and access to a level of 13.98 will be charged if the price of silver will begin to close the accounting period (month) above 18.23.

Weekly schedule
Silver or stagnation over


On the weekly chart shows that the price has done in March 2015 as part of the range. rebound 61.8% Fibonacci retracement (17.27), showing the local maximum at 17.4195. This week the price closes below 16.89 is likely - the middle of the 2015 range. After the March rebound in April, the price will fall back to the middle of the previous growth (16.3575), indicating that the price consolidation in the range of 15.3-17.42. On the strong support of 15.53 and 15.3 are shown weekly chart
In 2013. on silver formed a moderate downward corridor. Within its framework, yet it stands out technical resistance 18.6, but in May, the upper limit of the corridor falls to $ 18 an ounce. local minimum level (18.6375) in May 2014., which was knocked down in September 2014. In late January of this level has been tested as a resistance to the wave of interest in precious metals (gold and silver) in the face of the threat of a Greek exit from the eurozone. Recession fears over a Greek exit from the eurozone and expectations the US Federal Reserve raise interest rates in 2015. did not allow the price of silver to test this resistance to aggressive manner.

The daily chart
Silver or stagnation over


The price of silver at the end of March or beginning of April drew the formation of a double top. The movement of prices down 9 April (after the publication of the Fed's minutes of 18 March) raises the question of breaking through the support 16.45. The first target of this break Fibonacci 15.92
In the last review, we have argued that "in the end of March the price of silver has defined its range in the 16.45-17.42 area. Below it there is support for 16.1. "

Related posts


  • USDRUB


    USD / RUB In the last days of a bygone weeks ruble showed weakness of the ruble crash when stable oil prices may indicate the possible start selling...


  • Forex ee Economic Daily Digest


    Forex.ee: Economic Daily Digest Daily Digest of economic Forex . ee Keep an eye on major economic news with us Thursday, the 14 th of July GBP / USD...


  • Forecast for coming week on DAX


    The forecast for the coming week on the DAX! In the long term DAX expects the decline up to 6200. In this chart pattern shows us head and shoulders month...


Next posts


  • Why is American dream can fall

  • Ruble has fallen sharply against

  • US trading closed in green zone

In April Moscow Exchange will

In April, Moscow Exchange will allow transactions in dollars

reportedly
on the website of the Moscow Stock Exchange, with
April 27 investors
"Along with the calculations in
rubles will be technically possible
transactions with foreign securities
securities with settlement in US dollars. "
This was also told
deputy chairman of the Moscow Exchange
Andrew Chemetov edition
"Vedomosti".


"We see
big
demand for dollar liquidity,
It runs a lot of dollar products,
such ETF for eurobonds", - He speaks
Chemetov. he also
added that the sale of
currency should provide
investors greater protection.


Besides,
participants will
opportunity to make
guarantee fund in dollars
and euro bonds or federal
loan. At the moment
You can only make
rubles.


changes
touch and Derivatives Market
- there will be inducted mode
automatic options are exercised.
Since the end
April options on quarterly futures
in the course of USD / RUB and EUR / RUB will be executed
automatically in the daily clearing.

And finally,
Moscow Exchange expands
list of securities admitted to trading
partial collateral and
provide players
the ability to trade in bonds,
denominated in RMB and
British pounds, as well as
perform calculations in these
currencies.


Related posts


  • On Moscow stock exchange indexes


    On the Moscow stock exchange indexes appear to help evaluate the effectiveness of state-owned companies According to the press service of the Ministry of...


  • Chinese bankers teach Moscow how


    Chinese bankers teach Moscow how to pay in yuan On Thursday, representatives People's Bank of China and Bank Of China reported in the capital calculation...


  • Ukrainian Exchange was deprived


    Ukrainian Exchange was deprived of license National Commission of Ukraine on Securities and Stock Market yesterday recognized the Ukrainian Exchange a...


Next posts


  • Silver or stagnation over

  • Why is American dream can fall

  • Ruble has fallen sharply against

Monday, October 23, 2017

Daily Economic Digest from Forex
Daily Economic Digest from Forex.ee

Daily Digest of economic Forex.ee

Keep an eye on major economic news with us


Wednesday, June 28


Couple EUR/ USD It is trading in positive mood in the middle of this week,
Brush up on your multi-month highs at 1.1380 in early European
trading. Yesterday the pair received a major boost from a bullish "hawkish"
Comments from ECB President M.Dragi. During his speech at the symposium
ECB Mr. Draghi stressed that a lower level of inflation is a temporary
and the growth of the eurozone economy gradually begins to accelerate. such statements
the head of the regulator market took as an allusion to the possibility of folding QE program, thereby heating demand for a single
currency. Moreover, the US dollar largely ignored yesterday
speech of the Fed Chairman Dzh.Yellen and continued to fall relative to their
main competitors on the background of a delay in the Senate vote on the bill on
healthcare. Looking ahead, today the markets will be watching
events in the forum of the ECB, which takes place in Portugal, including the performance of
ECB President M.Dragi to be held later in the course of the trading session.


reaching
3-week highs at 1.2861, couple GBP / USD included in the consolidation phase, remaining near the level of 1.2815 in
During the Asian session, as the bulls took a breather after a sharp rise
pair. Meanwhile, published yesterday, the Bank of England report on financial
Stability noted the risks associated with the negotiation of Breksitu. But markets
mostly ignored the little "pigeon" report and the speech of the BA
M.Karni regulator, as the pervasive weakness of the US dollar continues
to be the main driver in the market, thereby facilitating growth of the pair. Today
the list of economic events planned one more statement of the Head of the BA
M.Karni be held at the Symposium of the ECB, as well as data from the market
US real estate, but the dollar's decline will continue to define the future direction
couples in today's session.


Couple USD / CAD continues its large-scale
reduction, updating 4-month low at 1.3129 as the Canadian
bulls are still full of energy. Today the pair again came under pressure from the
bears during Asian trading after the "hawkish" comments head of the bank
Canada S.Poloza, who once again reiterated that the previous decline
the interest rate is no longer necessary, thus have a significant
Canadian support. In addition, the dollar resumed sale, backed by a delay
vote in the US Senate on the health care bill, as well as
recovery in oil prices put further pressure on this pair
Wednesday. Now all attention is focused on the speech the head of the BC S.Poloza that
It will be held later in the trading session in the CA, while reports on the index of pending
sales in the real estate market in the US crude oil inventories could also affect
a couple in the CA's trading session.


Couple USD / JPY I found support at the district level
112.00 during Asian session and updated today's high-level
112.40 in early European session amid minor attempts of the US dollar
to restore its position in all directions. However, further potential
growth remains limited as continued risk aversion,
supported by the final day of the Forum of the ECB, which takes place in Portugal, promotes
demand for safe-haven currencies on Wednesday. Moreover, it is expected that the US dollar will continue to
lose ground during the day, as the market is still discussing respite
vote on the health care bill in the Senate, which has caused
concern about the ability of the administration of US President D.Trampa
fulfill their promises. Today, all attention will be focused on the market for the summit
central banks, which will also take part in Kuroda while widespread
predisposition to risky assets and the dynamics of the US dollar will remain
the key driving factors for the pair on Wednesday.


main
events of the day:


The speech of the Bank of England M.Karni - 16.30 (GMT +3)


The speech of the Bank of Canada S.Poloza - 16.30 (GMT +3)


ECB President M.Dragi - 16.30 (GMT +3)


The index of pending sales in the housing market USA-
17.00 (GMT +3)


Crude oil reserves in the United States - 17.30 (GMT +3)


levels
Support and resistance for the major currency pairs:


EURUSD P.
1.1117 C 1.1459


P. S. USDJPY 111.09 113.09


GBPUSD P.
1.2651 C 1.2941


USDCHF P.
0.9502 C 0.9784


AUDUSD 0.7547 P.
S. 0.7641


NZDUSD P.
0.7213 C 0.7371


USDCAD P.
1.3089 C 1.3315


The best conditions for the start at the STP only Forex.ee! Sign up account is now

and feel the difference with the first deal!

your Europe ECN-broker,

Forex.ee


Related posts


  • Forex ee Economic Daily Digest


    Forex.ee: Economic Daily Digest Daily Digest of economic Forex . ee Keep an eye on major economic news with us Monday, June 20 GBP / USD It rose more...


  • Daily Economic Digest from Forex

    Daily Economic Digest from Forex.ee Daily Digest of economic Forex . ee Keep an eye on major economic news with us Wednesday, August 30 Couple EUR / USD...


  • Forex ee Economic Daily Digest


    Forex.ee: Economic Daily Digest Daily Digest of economic Forex . ee Keep an eye on major economic news with us Wednesday, May 25 EUR / USD He moved away...


Next posts


  • In April Moscow Exchange will

  • Silver or stagnation over

  • Why is American dream can fall

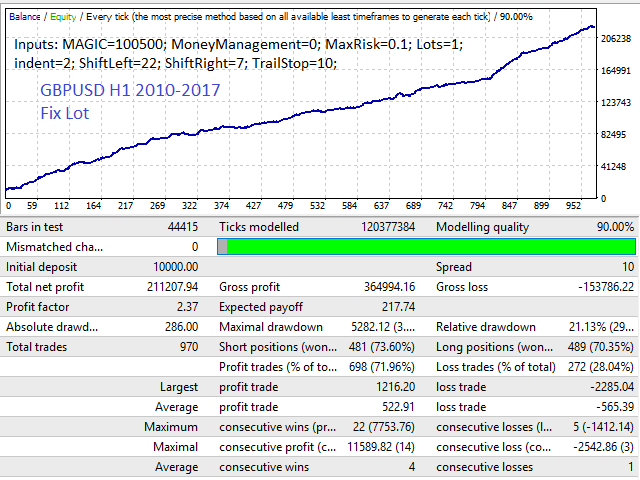
Plutus EA

plutus EA


plutus EA - without indicating Advisor trading on the strategy based on the breakdown of support and resistance levels.


Advisor uses: arbitrage, hedging, martingale, grid strategies, etc.


It is a low-risk and stable trading robot.


It is integrated and innovative filter signal adaptive trailing stop.


Always set a stop-loss and take-profit to protect the deposit.


It allows trading fixed lot, and also includes capital control unit (Money Management) for the automatic computation of the lot, depending on predetermined settings at risk for one transaction.


By default, the expert settings are set for the pair GBPUSD timeframe H1, for the rest of the tools necessary to correct the settings.


requirements


  • Currency pairs: GBPUSD, EURUSD, USDJPY;

  • timeframe: H1;

  • Minimum deposit: $ 100;

  • Account type: ECN.


Options


  • Magic - Councilor orders identifier;

  • MoneyManagement - if true lot size increases with the balance of the account;

  • MaxRisk - deposit interest use (used in MoneyManagement = True);

  • Lots - fixed lot (if used MoneyManagement = False);

  • Indent - offset from the support and resistance levels;

  • ShiftLeft - left shift bars for the calculation;

  • ShiftRight - shift bars in the right for the calculation;

  • TrailStop - a basic level of trailing stop.


Plutus EA

Related posts


  • Zone pips


    Zone pips Zone pips - fully automated Forex- Advisor , which uses two types of orders : Buy Stop and Sell Stop. Advisor also uses the system recovery...


  • Joker System Stable


    Joker System Stable The new version poluskalperskogo multicurrency Expert Advisor , which uses an advanced adaptive trading strategies based on the...


  • FNA MT4


    FNA MT4 Two strategies in one EA! Simple classic strategy of "breakdown at the level of fractals": This strategy may be used on the timeframes M15 and...


Next posts


  • False BreakOut EA

  • I Robot Merchant

  • Need for Speed

Thursday, October 19, 2017

SynchroObjects

SynchroObjects


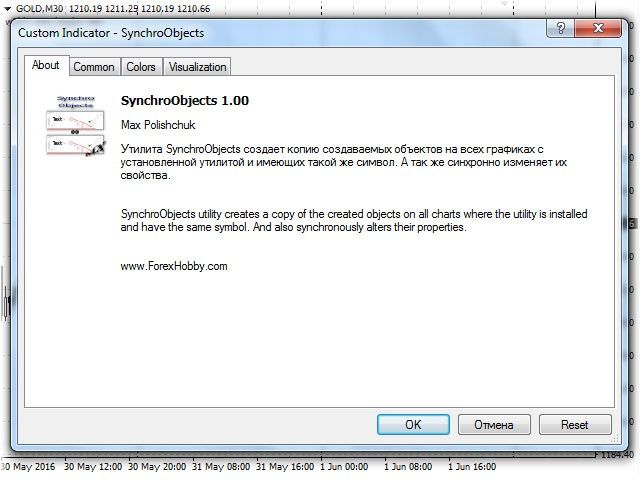
Utility SynchroObjects It designed for comfort and speed of graphic constructions on different charts of one character. SynchroObjects Clones created objects on all schedules that are running the utility and with the same symbol. As well as synchronously changes their properties.


The utility is easy to use and requires no configuration.


Council: If you frequently access a story - it is recommended to also install schedule a free utility Smart AutoScroll. It will automatically disable the auto scrolling schedule once you begin to view your history.
Council: You might also like a free utility SynchroCharts. It allows you to simultaneously view historical quotes on multiple charts synchronizing schedules on time and timeframe.


SynchroObjects

Video


Related posts


  • Slide Trend


    Slide Trend Slide Trend - A simple indicator showing the trend and allows you to quickly and easily move between schedules. It is designed for fast...


  • Fibo


    Fibo The script sets the chart Fibonacci levels are visible on the chart highs and lows. The script sets the Fibo name timeframe , which has been started...


  • Tipu Panel


    Tipu Panel Tipu Panel displays trends / signals at selected timeframes and running indicators (separately installed). For greater efficiency it is...


Next posts


  • StockTime MT4

  • Expert Non Loss

  • Ultimate Panel Demo

Wednesday, October 18, 2017

Gold at two week highs on dollar

Gold at two-week highs on the dollar weakening

gold rises
since yesterday, taking advantage of
the weakening of the dollar. On Wednesday
it reached almost two weeks
highs: gold
delivery in June to 11.11 MSK worth $ 1
194.20. Spot gold trading to 11.13 MSK
$ 1 194.99.


support
precious metal is weakened
and financial and stock markets immediately.
Recall from Monday at the world
bond markets played out strong
volatility. Yesterday again jumped
the yield on 10-year German bonds,
rising to six-month highs,
before stabilizing. Usually
an increase in bond yields
reduces investment demand for
non-interest assets - such as gold.


"The question that
now it faces the gold - hold
whether it is a weak pulse of dollars or
Still, increase of yield on the debt
market again presses on the metal and make
his move away from the psychologically important
the level of $ 2,000 per ounce, "- says
HSBC analyst Dzheyms Stil.
While to all appearances, the dollar and the weak
US macroeconomic impact
gold stronger, supporting him in
ascent.


Related posts


  • Gold becomes cheaper because recovering


    Gold becomes cheaper because recovering stock markets On Wednesday, the growth quotations of gold stopped. Yesterday, China again softened monetary...


  • Dovish FOMC minute lifted gold


    Dovish FOMC minute lifted gold to a five-week high at today trading gold rose to the highest level in the last five weeks. K 11.22 MSK yellow metal with...


  • Gold moved down and is held in


    Gold moved down and is held in the neighborhood of $ 1185 under pressure from the Fed , China and Greece quotes Gold on Tuesday froze in the zone where...


Next posts


  • Daily Economic Digest from Forex
  • In April Moscow Exchange will

  • Silver or stagnation over

Ruble against dollar becomes more

The ruble against the dollar becomes more expensive for the fourth consecutive session

During trading on Wednesday,
day exchange rate against the dollar is growing rapidly, according to
exchanges - this is the fourth day of strengthening
Russian national currency. In addition, with
Yesterday the ruble began to strengthen
and against the euro. According to experts,
courses movement associated with the tax
period and falling demand for currency.


dollar to 14:16 MSK
57.106 amounted, according investing.com.
On the Moscow stock exchange in this
the pair USD / RUB traded
at the level of 56.895. The pair EUR / RUB
trading at
62.656 and 62.492 (on the Moscow Stock Exchange).

Analysts say
ruble finally felt his
regains strength and offset currency
flows on the stock exchange in its favor. On
Today, for example, outlined ambitious
transfer to the budget the severance tax and excise taxes.
To do this, exporters and other players
the market will have to sell the currency, which
They stocked up earlier in the hope her
growth.


Moreover, against the background of
dollar and euro jump up (at the end of
last year) imports in recent years
substantially reduced and, therefore,
foreign currency for purchases of imported
goods must be less. Demand
currency also fell when the Russian
the company passed the peak of payments on corporate
debts.


As a result, today
session on the Moscow stock exchange Dollar
I descended to the level of 56.612 rubles and euros. -
to 62.087 rubles.


Russian forecasts
Analysts quite positive. So,
Andrei Zaitsev of Absolut Bank believes
that the current borders - it is not the limit.
"Expected trading range: 56-58
rub. per dollar. Apparently, the strengthening
rubles due to the echoes of tax
payments and the lack of demand for foreign currency.
However, the fundamental reasons for the
Growth of the Russian currency continues
There are no", - he said.


Another "key
date "for the currency market - March 30,
when companies will pay tax on
profit.


Related posts


  • Ruble fell in anticipation of


    The ruble fell in anticipation of the Central Bank meeting and amid weak activity Exporters This afternoon, the Russian Ruble reduced trades the currency...


  • Free fall of ruble 69 5 euros


    Free fall of the ruble: 69.5 euros per dollar of 63.5 On Tuesday morning, the ruble It continues to weaken after uncertain behavior on Monday. Play...


  • Strengthening of ruble creates


    Strengthening of the ruble creates conditions to reduce the key rate CBR? Bloomberg The ruble rose to its highest level in three months against the...


Next posts


  • Gold at two week highs on dollar

  • Daily Economic Digest from Forex
  • In April Moscow Exchange will

Monday, October 16, 2017

OneTM TrendFinder

OneTM TrendFinder


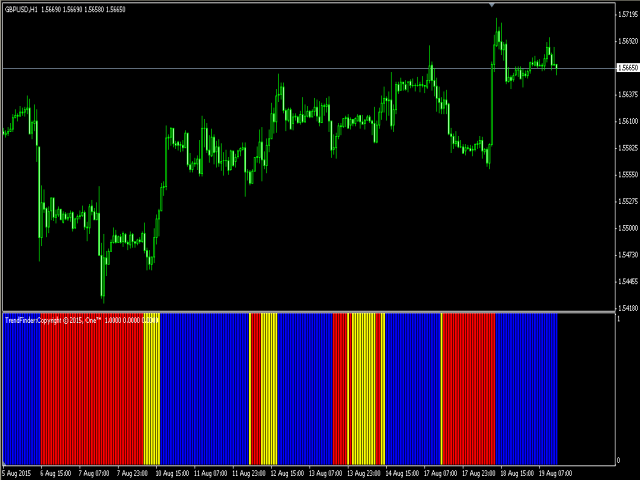
The indicator uses a complex algorithm for calculating the ratio of RSI and moving averages.


The values ​​of the RSI indicator is used in the calculation of multiple moving averages to detect a trend and neutral zones. The system generates signals based on the interaction of three exponential moving averages (EMA) and RSI.


The signals are displayed on a histogram as red, blue and yellow bars. The blue bar indicates a bullish trend and the possibility of buying. Out of the market should be the appearance of yellow or red bar. Reverse (by a red bar) for the right of sell orders. Yellow bar indicates to the flat state of the market and the inability to determine its future direction. In this case, it is better not to enter the market.


  • trend detection system to avoid the market "noise."

  • Effectively displays trend and to the flat area (red bars indicate a bear market, blue - a bull, yellow - on to the flat).

  • Well suited for Scalping trade.

  • It is not redrawn.

  • It does not change the previous data.

  • Not recalculated.

  • Signals are generated strictly at the close of each bar.

  • It may be part of the advisor.


Options


  • RSI_Period: The number of days for calculation of RSI.

  • Fast_RSI_MA: The period of the fast moving average for RSI.

  • Slow_RSI_MA: Period of slow moving average for RSI.

  • RSI_MA_Method: The moving average method for RSI (default - EMA).

  • -RSI_MA_AppliedPrice: Type RSI prices (by default - the closing price).

  • Up_Color, Down_Color, Neutral_Color: Color bull, bear, and to the flat bars.

  • Up_Width, Down_Width, Neutral_Width: Histogram width.


There are also options of color graphics and types of alerts (pop-up window notification, and email) with the ability to enable / disable.


OneTM TrendFinder

Related posts


  • MarketMeter


    MarketMeter It is easy to use for multiple timeframe indicator cluster analysis of these currencies. It provides a simple but at the same time effective...


  • NewBbandsMT4


    NewBbandsMT4 Probably every trader known indicator Bollinger Bands (Bollinger Bands). This indicator is similar to moving average envelopes, but based on...


  • Multicurrency Cross Oscillator


    Multicurrency Cross Oscillator Description Color universal indicator / oscillator crossing moving averages. It is possible to raise or lower coloring...


Next posts


  • Bollinger Histogram

  • MA Swing High Single Time Frame

  • Analyzer PRO

Analyst from company ForexMart

Analyst from the company ForexMart (ForeksMart)

Technical analysis of the levels of Pivot 22.06.

EUR / USD
By the end of yesterday, the pair could be close to the support level 1.1164. Today, the pair is trading above the Pivot 1,11524 level. Trading volumes are low. MACD is rising. RSI decreases from perekuplennosti zone boundaries. We are waiting for the growth of the pair to 1.12. Support levels: 1.11383, 1.11109, 1.10968. Resistance Levels: 1.11798, 1.11939, 1.12213

GBP / USD
The pair yesterday was able to demonstrate growth in the region of 1.27. Toward the close of the session corrected to 1.2670 where trades so far. In hourly chart pound located above Pivot 1,26549 level but below SMA200. RSI tends upward. MACD slightly reduced. We are waiting for growth to 1.27. Support levels: 1.26079, 1.25416, 1.24946. Resistance Levels: 1.27212, 1.27682, 1.28345

AUD / USD
Today, the pair is trading below the level of Pivot 0,75584. On H1 quotes went under the middle line of Bollinger. MACD is increasing slightly. RSI is reduced. Today we expect trading within a narrow range. If the pair will go under 0.75, the forward loss. Support levels: 0.75372, 0.75211, 0.74999. Resistance Levels: 0.75745, 0.75957, 0.76118

USD / CHF
The pair is trading below the level of Pivot 0,97309. RSI tends down into the oversold zone. MACD rises from the negative to the positive region. We are waiting for the pair today fall into the area of ​​the third support with subsequent growth up. Support levels: 0.97139, 0.97050, 0.96880. Resistance Levels: 0.97398, 0.97568, 0.97657

The analysis of commodity currencies on June 22

Brent
Quotes of oil continues to decline, despite a positive report from the US Department of Energy. Statistics recorded a reduction in stocks of crude oil and its derivatives to 2.451 million barrels, well above forecasts. This has contributed to the short-term strengthening of the position of oil to $ 46.18 per barrel, but later re-quotes updated local minima at $ 44.36. In this regard, OPEC plans to introduce an additional reduction of quotas.

USD / CAD
As a result, the oil falling to a 10-month lows quotes pair USD / CAD moved to increase. However, the US dollar was unable to overcome the 1.3350 level, and at the moment the pair shows consolidation below this level. A further fall in the loonie is unlikely due to the rather rigid position of the Bank of Canada, rendering support to the national currency.

USD / RUB
The new drop of oil once again a negative impact on the ruble. the dollar first rose above the level of 60 rubles. Despite the decline in crude oil inventories in the US, the volume of most hydrocarbon production continued to rise. If OPEC will come to the decision to change the terms of the new Treaty of Vienna, this can positively affect both the oil and the ruble. In addition, the ruble is supported by a tax period, so during the day expect decrease in pair to the level of 59.50 rubles.

22.06. fundamental analysis

The focus today: Index Core retail sales in Canada

Reserve Bank of New Zealand left interest rates unchanged. The New Zealand dollar strengthened because officials are not worried about currency appreciation. In addition, they noted that the growth prospects of the economy are positive, as are supported by population growth, changes in the budget and ongoing monetary policy.

Petroleum currency weakened after the appearance of data on oil reserves in the United States, which decreased by 2.5 million barrels.

The British pound fluctuated during the North American trading session. On the one hand, investors are worried because of the political instability: the problem of Tereza Mey to create a coalition government, "Breksit" etc.

On the other hand, the Bank of England unexpectedly took a tough stance. Yesterday, Endi Haldeyn, a member of the Monetary Policy Committee announced the "hawkish" view, calling the currency rise. However, let us not forget that the head of the Bank of England Mark Karni does not support the idea of ​​raising rates.


Related posts


  • Analyst from company ForexMart


    Analyst from the company ForexMart (ForeksMart) 13.07. fundamental analysis The focus today: The index of producer prices in the US Speech by US Federal...


  • Strengthening of ruble creates


    Strengthening of the ruble creates conditions to reduce the key rate CBR? Bloomberg The ruble rose to its highest level in three months against the...


  • GBPUSD at end of year is expected


    GBP / USD: at the end of the year is expected to increase demand for the dollar current dynamics at the last week British currency significantly...


Next posts


  • Ruble against dollar becomes more

  • Gold at two week highs on dollar

  • Daily Economic Digest from Forex
Friday, October 13, 2017

Open lock

Open lock


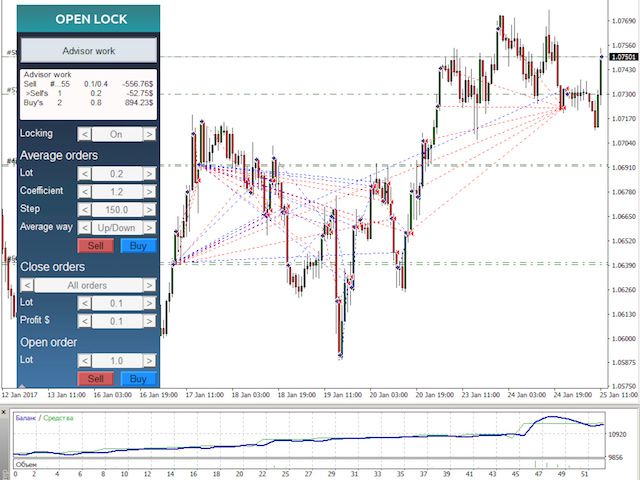
Advisor reduces loss on open positions and closing of the transaction minus into a plus.


Ability to work in tandem with other advisers. For example, when your advisor has accumulated loss, Open Lock can turn it off and take a job with the transactions themselves.


Methods of money management


  1. Blocking to prevent an increase in the drawdown;

  2. Averaging orders, which are necessary for the closure of the loss;

  3. Partially closed to reduce the load on the deposit.


Averaging orders are opened in small lots, not to load deposit.


Gain according slips used for partial closing distance losing position.


After closing the position averaging Advisor aligns lock.


Options


  • Language - language interface control panel;

  • Magic number - unique number of orders averaging. Should not the same as the magic number of other advisors

  • Maximal lot in average ord (0-not used) - maximum lot, which will open a counselor in an averaging order. When 0 is not limited to the lot

  • Dinamic step - whether to use a dynamic step in the discovery of new orders


    • Not used - do not use

    • Step x Multiplier - a new order will be opened through a step multiplied by a factor (option is only pitch increase ratio should be greater than 1)


  • Maximal step (0-not used) - maximum pitch (pip), which can be set between Averaging orders. When 0 step is not limited. This parameter is used only when the dynamic step.

  • Start work - when to start work with transactions


    • At startup - immediately after the start

    • By drawdown level - after reaching a level of drawdown


  • Drawdown in curr - drawdown size deposit currency (Required if the above selected By drawdown level)

  • Stop another advisors - the ability to stop the work of other advisors in this terminal


    • Not use - do not use this feature

    • Close other charts - close other graphics to disable the work of other advisors (works only when the drawdown level)


  • Time to open orders - time averaging is allowed to open orders


    • All time - Anytime

    • Schedule for opening average ord (24H) - only the specified interval


  • From - hour, with which permitted to trade, if the selected trade scheduled (possible values ​​from 0 to 23)

  • To - h, to which is permitted to trade, if the selected trade scheduled (possible values ​​from 0 to 23)


If the work is planned in the evening until the morning, it is necessary to specify the From: 22 To: 6


If the work is planned in the afternoon, the From: 12 To: 21


Control Panel


  • Blocking - full Blocking positions in financial instruments. If you have opened five lots Buy, the Advisor will open another five lots Sell. Thus loss on account ceases to grow.

  • averaging order


    • lot - lot size for the first transaction

    • Coefficient - the amount by which the lot will increase each subsequent transaction

    • Step - distance between orders pips

    • Direction - which way will be opened averaging warrant

    • Buttons Buy / Sell - Allows you to manually open the averaging warrant


  • Closing orders


    • Selection of orders, It works with the adviser. You can select all orders or a particular. The list displays only the unprofitable orders

    • lot - a lot will be closed from losing trades. If the parameter is 0.2, and the transaction is open lot 1.0, the adviser closes an arm 5 steps

    • Profit - minimum income, which must be at the close of the averaging of the loss-making orders and orders


Advisor removes all levels of SL and TP. This is necessary for correct operation.


When specifying the direction of trade should be established averaging lot more than a lot, which you close.


Testing


When you run the advisor to the deal itself opens, which then tries to close with profit.


You can use the buttons at the bottom of the control panel to open additional market orders.


Open lock

Video


Related posts


  • YPY EA Serena NG PRO


    YPY EA Serena NG PRO YPY EA Serena NG PRO - multi- currency trading robot that uses an adaptive strategy skalpingovuyu a quiet market and implement...


  • Artificial Neural Network Plus


    Artificial Neural Network Plus EA trades on signals of an artificial neural network. Network with one hidden layer. The presence of the signal is checked...


  • Fx Splitter


    fx Splitter FxSplitter - robot trading basket warrants. Individual orders open basket periodically at fixed intervals. When it is the set time, the robot...


Next posts


  • Plutus EA

  • False BreakOut EA

  • I Robot Merchant

Thursday, October 12, 2017

MULTIGAP

MULTIGAP


MULTIGAP - multi-advisor
working for Gap.


gap - the emergence of "gap" between quotations Friday's closing and opening of quotations
Monday.


When the gap on Monday the deal will be open on the
currency pair, where the maximum gap. The transaction will be opened if the GAP More
porog_gap threshold.


Perhaps the opening of the second additional transaction while driving
prices in the opposite direction by an amount greater porog_otl.


Transactions are closed by stop loss, take profit or
occurrence of certain conditions.


Default used major currency pairs: EURUSD,
GBPUSD, EURGBP, USDCHF, EURCHF, USDJPY, EURJPY, USDCAD, AUDUSD, NZDUSD.


You can use up to 10 currency pairs.


settings for
5-digit account:


  • HOUR_START - hour opening of trading on Monday (default 0).

  • porog_gap - threshold gap (at
    Default 200, 4 characters = 20).

  • tp -
    level take profit in paragraphs (170, 4 characters = 17).

  • sl -
    level stop loss in paragraphs (2000, 4 characters = 200).

  • porog_otl - threshold extension
    order (default 340, 4 characters = 34).

  • magic - magic number
    main order.

  • magic2 - magic number
    additional orders.

  • risk - the risk of the interest on
    available free margin level (recommended 1-30).

  • lot -
    Lot trade, is used when the risk<= 0 or risk>100.

  • ind - indication flag (true - display on the screen,
    false - not show).

  • symbol_1 -
    the name of the first trading symbol (for example, EURUSD).

  • torg_1 - if true, the trade of the first character is allowed.
    If false, then no.

  • ...

  • symbol_10 -
    the name of the tenth trading symbol.

  • torg_10 - permit trade
    ten characters.


MULTIGAP

Related posts


  • EA PENDING ORDER risk


    EA PENDING ORDER risk Advisor pending orders The operating principle of the adviser is quite simple and concise. Limit orders Advisor (Expert Pending...


  • Exp TickSniper FULL


    Exp TickSniper FULL This expert is able to capture the rapid movement quotes and currency pair open transaction in the direction of movement. All the...


  • FollowTheTrendMulti FREE


    FollowTheTrendMulti FREE This is a limited version of the advisor "FollowTheTrendMulti" (https://www.mql5.com/ru/market/product/11524). Advisor...


Next posts


  • ChosenBest

  • DualDeviationChannel

  • Pathfinder

Wednesday, October 11, 2017

Greek minister predicted collapse

Greek minister predicted the collapse of the euro zone

Minister
Greek Finance said Yanis Varoufakis
in an interview with Spanish television channel La
Sexta, that if Greece leaves
eurozone, it will inevitably lead to the departure of
other countries.


"He
who plays with the idea of ​​Greece cut off from
the euro area in the hope that the remaining
survive - is playing with fire. Some
They argue that Europe and the ECB have in
disposal tools that
let amputate Greece in case
necessary to cauterize the wound and let
the rest of the eurozone countries to live in peace
farther. I very much doubt that this is so.
Not just about Greece, but also about
any other part of the European Union. After
how the idea of ​​"non-eternity 'currency
Union will be familiar to people,
speculation begin: who's next?
This question will act as a solvent
for the monetary union. Sooner or later
it will happen".


Related posts


  • Buffett Greek exit from eurozone


    Buffett: Greek exit from the eurozone would not tragedy Yesterday In his interview for the CNBS Billionaire investor Warren Buffett suggested that the...


  • Greek crisis can not help gold


    Greek crisis can not help gold: it is again below $ 1 , 200 On Thursday the price Gold did not show great changes, remained around two-week lows. By...


  • EURUSD Euro continues to lose


    EUR / USD: Euro continues to lose ground against the dollar During the Asian trading on Tuesday morning, the euro against the the dollar continued its...


Next posts


  • Analyst from company ForexMart

  • Ruble against dollar becomes more

  • Gold at two week highs on dollar

Tuesday, October 10, 2017

RSI Selfoptim

RSI Selfoptim


The essence of this indicator is very simple. The basis was taken RSI oscillator and in his work, it was observed that the strong market RSI directional movement and dramatically altered their values ​​between neighboring bars. For RSI Sefloptim Taken as a basis algorithm statistical analysis of these changes and finding their extremes. With such statistics, which is always improving and updating in progress, the indicator provides a point to enter the market.


Description parameter


  • Optim_start - number candle / bar beginning RSI indicators analysis interval.

  • Optim_end - number candle / bar end indicators RSI analysis interval.

  • Visual - indicator displaying the number of bars, starting with zero.

  • SizeArrow - arrow-resolution signal to enter the market.

  • Distance - away from the maximum or minimum signal candle arrows.

  • Sensitivity - settlement period indicator.

  • k - factor from zero to one. It specifies the percentage of the extremum in the analysis of RSI values ​​change.


Recommendations for use


  • For a more accurate operation is not set very large candles analysis ranges. It is advisable to take no more than 100.

  • For a more complete analysis it is recommended to select intervals of high volatility, but not too far in history.

  • Coefficient k best shown itself at values ​​in the range of 0.3-0.5.

  • Indicators k below 0.3 increased amount of signals, but also reduce their quality. Plus the fact that you can have time to go for the best price at a strong trend.

  • Indicators k above 0.5 gives signals less risky, but also less cost to enter.


RSI Selfoptim

Related posts


  • Scalper Dream Dynamic Filtered


    Scalper Dream Dynamic Filtered The indicator is designed specifically for the market scalping on trend! portions on timeframes M5 -H1, a complex...


  • MacdPlus


    MacdPlus Indicator Moving Average Convergence Divergence (or MACD) - This trendsledyaschy momentum indicator showing the relationship between two moving...


  • Bill Williams SquatGreenFadeFake


    Bill Williams SquatGreenFadeFake patternFinderFREE The indicator provides a signal when a squat, green, fading or fake bars. You can adjust the display...


Next posts


  • OneTM TrendFinder

  • Bollinger Histogram

  • MA Swing High Single Time Frame

Monday, October 9, 2017

Asian markets ended day in green

Asian markets ended the day in green zone

Today
Asian optimism reigned. the MSCI
Asia Pacific added,
little - only 0.1%, but the main
national indicators showed
pretty impressive results.
Nikkei
up to 0.65%,
Shanghai
Composite jumped
to 2,6%, Hang
Seng added
1,5%, KOSPI
firmed 0.51%. China
again holds the lead thanks
to the head of the regulator, which
He promised to support economic
recovery and assured investors that
in China the authorities are available for this
resources. This confidence is a positive
It reflected in all markets
Asia-Pacific region, with the
except Australia, which
today dipped by 1.3% due to the fall in prices
for raw materials.


increased
shares of Chinese banks and insurance
Companies: Industrial
Bank Co added
8,8%, Citic
Bank - 3.4%,
New China
Bank Insurance - on
6.4%.


grows
capitalization of Industrialists and
Developers: Zoomlin
Heavy Industry Science Technology added
10%.


Related posts


  • Sentiment in Asian markets cool


    Sentiment in Asian markets cool due to weak PMI in China AT Monday declined stock prices virtually the entire Asia-Pacific the region as investors...


  • Asian stocks were down on Monday


    Asian stocks were down on Monday fears Greek default and turbulence on major world markets affected today at the Asian stock indexes. All the major...


  • US markets supported chorus fall


    US markets supported the chorus fall Tuesday Yesterday, 22 September, stock markets in the US fell by 1.1-1.5% pulled down the indices falling quotes...


Next posts


  • Greek minister predicted collapse

  • Analyst from company ForexMart

  • Ruble against dollar becomes more

Friday, October 6, 2017

Ichimoku MTF

Ichimoku MTF


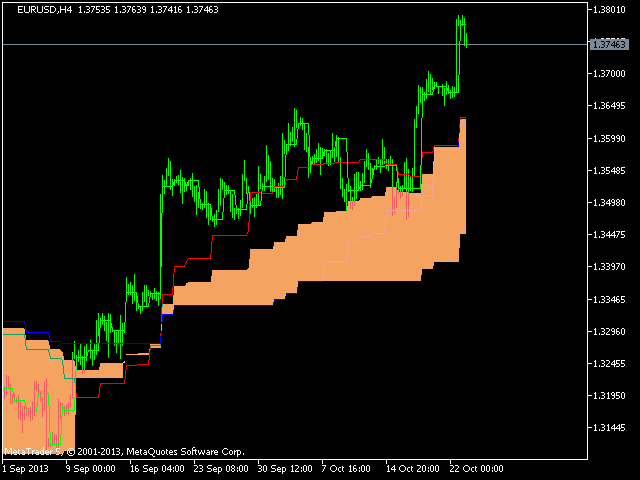
MTF Ichimoku - an indicator for MetaTrader, based on the well known Ichimoku.


Ichimoku is included in the standard set of technical indicators MetaTrader 5. However, it can only be used on the current timeframe. When looking for a trend it is very desirable to view the Ichimoku indicators built on higher timeframes. MTF Ichimoku indicator has a second parameter - TimeFrame. In it, you can specify a time frame, according to the values ​​which the indicator will be built.


All other basic settings are not changed.


In this version, you can also specify the number of bars for the construction of the indicator.


Ichimoku MTF

Related posts


  • TSO Currency Trend Aggregator MT5


    TSO Currency Trend Aggregator MT5 Indicator TSO Currency Trend Aggregator job compares the behavior of currency pairs 7. It allows you to instantly...


  • Herrick Payoff Index


    Herrick Payoff Index payment index Herrick (Herrick Payoff Index, HPI) confirms the strong trends and helps determine when they change its direction;...


  • Mt5 Classic PivotPoints


    Mt5 Classic PivotPoints There are various ways to configure Classic Pivot Points indicator . If you prefer to trade manually and graphics without...


Next posts


  • OnBalanceVolumeSurrogate MT5

  • Extended Keltner Channel MT5

  • Triple Channel MT5

Thursday, October 5, 2017

Oil continues to fall in price

Oil continues to fall in price on expectations of news on Iran

Futures
Oil continued to move down in the
Tuesday. At the time of 10.53 MSK May
contract for Brent stands
55.65 dollars per barrel, WTI futures
It fell to 47.85 dollars.


Cause
continuation of the fall is that Iran and
Six world powers continue
Negotiations to alleviate sanctions. it
potentially send to the world market
Iranian oil stream. However, the result
negotiations still
unpredictable: the officials said,
that a framework agreement (the prelude to
comprehensive final agreement,
scheduled for the end of June) can be
and has not been reached. Any claims
the pace of the lifting of sanctions (from Iran)
and for Nuclear Research (from
West).


analysts
ANZ in its morning note
It said today that Iran has
significant reserves of oil for a long
time embargo in Iranian stocks
tanker fleet is stored at least 30
million barrels. All this immediately
will flood the world market as soon as
sanctions will be eased.

later
oil prices are expected to be
oscillate between 40 and 60 dollars
barrel if Iran will deliver
its raw materials, OPEC will not cut production,
and the shale revolution in the United States will not stop.
However, the world's hedge funds have increased
their bets on rising oil prices. it
applies only to Brent crude: in
Recently, the spread has grown
between the North Sea oil and WTI. By
Of WTI, in turn short
positions rose to a record high
levels.


Related posts


  • Brent wins back losses deal on


    Brent wins back losses: deal on Iran seems to be delayed crude oil Brent back up from the three-month low. By 14.29 MSK August futures is $ 57.30; WTI...


  • Price of Brent crude oil fell


    The price of Brent crude oil fell below $ 40 The price of Brent crude oil for the first time since mid-March has gone below the important psychological...


  • Speculators increasing their short


    Speculators increasing their short positions in Brent After rising by more than 50% in the period from February to March, the oil is rapidly becoming...


Next posts


  • Asian markets ended day in green

  • Greek minister predicted collapse

  • Analyst from company ForexMart

Wednesday, October 4, 2017

GND Average Price

GND Average Price


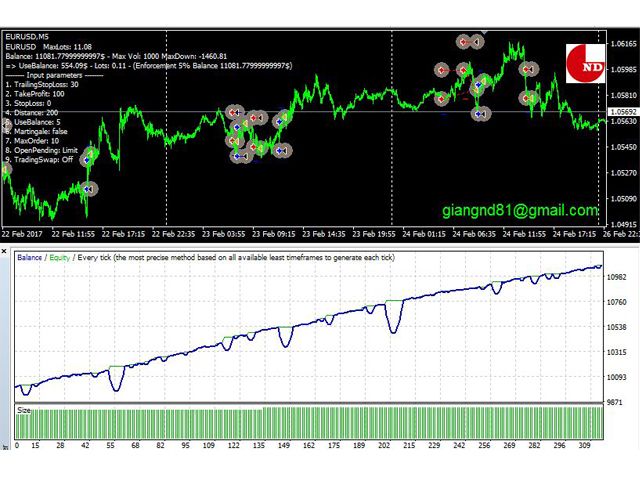
Advisor is based on a grid strategy and is designed to detect strong trends. It can also be operated at full speed with a minimal spread. The robot uses the average price of the transaction. If necessary, you can turn the martingale, hedging and scalping.


It is optimized and fully operational automated system. The settings are simple.


recommendations


  • Minimum deposit $ 1,000 or the corresponding amount to a cent account

  • Use with small spreads


Options


  • MagicNumber: Advisor magic number

  • TrailingStopLoss: Trailing Stop

  • MinStepTrailing: minimum step trailing

  • TakeProfit: Take Profit. 0 - Disabled

  • StopLoss: stop-loss. 0 - Disabled

  • Distance: the distance to the next order. 0 - Disabled

  • UseBalance: % used by available funds in the account (* UseBalance = 1%). If balance = $ 10,000 => the trade balance = $ 100 (0.01 on the balance = $ 100 with an increase)

  • Martingale: Martingale (True / False). Choose the method of martingale

    • True. Example: Lot = 0.01 for the order A, following lot = 0.02 for the order B, the next lot = 0.03 for the order C ...

    • False. Example: Lot = 0.01 for the order A, following lot = 0.01 for the order B, the next lot = 0.01 for the order C ...


  • Hedging: hedging. (When enabled, you can make both buying and selling)

  • MaxOrder: limit the number of orders in the grid

  • OpenPending: Stop / Limit

    • Stop. Example: The first order to buy, the next - BUYSTOP, the first order to sell, the next - SELLSTOP

    • Limit. Example: The first order to buy, the next - BUYLIMIT, the first order to sell, the next - SELLLIMIT


  • TradingSwap: Off / On. Use the value of the swap

    • Off. Default Trade

    • On. Example: Roll for sale > 0 - only to sell, swap purchase > 0 - Only buy.


Exemplary values ​​of the input parameters


  • MagicNumber: 4444

  • TrailingStopLoss: 100

  • MinStepTrailing: = 10;

  • TakeProfit: 300


  • StopLoss: 0

  • Distance: 200

  • UseBalance: 1

  • Martingale: True

  • Hedging: On

  • MaxOrder: 20

  • OpenPending: Stop

  • TradingSwap: Off


Note: Use the default settings. Before using a live account test counselor in the strategy tester. Advisor works with most brokers.


GND Average Price

Related posts


  • News Robot MT4


    News Robot MT4 At the time of the release of economic news can overcome the price dozens of items only in first minute after release. News Robot MT4 It...


  • Shredder


    Shredder The strategy is based on the breakdown of support and resistance levels. As a certain distance of the price movement the robot all the time...


  • Phantom


    Phantom Fully automated multi-adviser. Do not apply the martingale, grid trading . For protection use a stop loss. Powered pending orders permitted to...


Next posts


  • Open lock

  • Plutus EA

  • False BreakOut EA

Scalper Dream Dynamic Filtered

Scalper Dream Dynamic Filtered


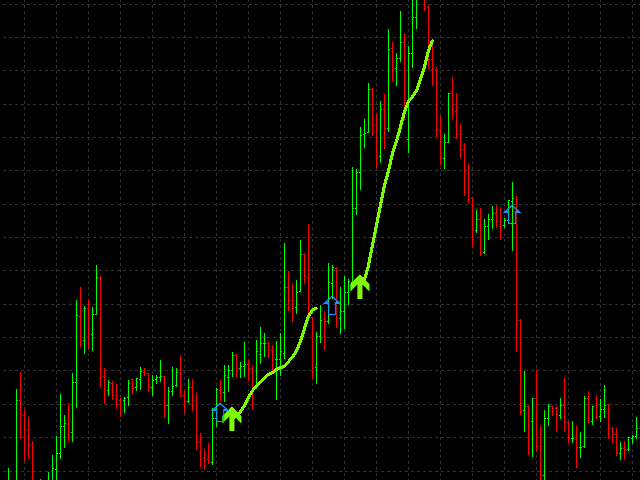
The indicator is designed specifically for the market scalping on trend! portions on timeframes M5-H1, a complex algorithm is a combination of several indicators for dynamically changing market. Besides the main signals are also present minor (faster but less accurate). For filtering signals, there are two built-in filter is disabled. Recommended for M15 TF. The signal is accompanied by an additional line of direction, at the end of which the probability of a price reversal increases. An arrow appears at the opening of the bar and remains, the indicator does not redraw their values!


Options:


  • UseConditionsBO - regime change priority of the basic conditions of Indicator

  • UseExplosionFilter - enabling / disabling power filter direction

  • ExplosionFilterFastPeriod - quick calculation period Filter force direction

  • ExplosionFilterSlowPeriod - slow period for calculating the filter strength directions

  • ExplosionFilterSmoothingPeriod - period of the smoothing filter strength directions

  • UseLongTrendFilter - enabling / disabling the filter term trend

  • LongTrendFilterPeriod - the period for calculating long-term trend filter

  • ShowAdvancedSignals - enabling / disabling secondary signals

  • UseExplosionFilterForAdv - enabling / disabling the filter strength for secondary direction signals

  • UseLongTrendFilterForAdv - enabling / disabling the filter strength for secondary direction signals

  • AddDigits - additional indicator accuracy

  • ArrowUpCode - arrow signal code up

  • ArrowDownCode - code signal down arrow

  • AdvArrowUpCode - additional code signal up arrow

  • AdvArrowDownCode - code additional signal down arrow


Scalper Dream Dynamic Filtered

Related posts


  • RightDirection


    RightDirection Indicator RightDirection great tool and assistant to work with the trend. He performed well when paired with other indicators that signal...


  • Simple Trade


    Simple Trade technical indicator Simple Trade , developed by a group of traders for your convenience. The indicator is calculated on a fairly complex...


  • Vidente


    Vidente Advantage: The others do not know (yet). Indicator Vidente for MetaTrader - tool to determine the price trend . For beginners it is a great help...


Next posts


  • RSI Selfoptim

  • OneTM TrendFinder

  • Bollinger Histogram

Monday, October 2, 2017

Framework agreement reached on

The framework agreement reached on Iran. Oil falls in price

On Thursday, Iran and 6
major world powers concluded
a framework agreement on curbing
nuclear program, at least in
for ten years. This is a major step towards
the final contract, which has
every chance to end a 12-year period
brinkmanship, threats and
confrontation.


"Black gold"
immediately responded to
News: immediately after the news
Brent talks about the end of
It fell to $ 54.10,
and WTI - up
$ 48.22. True,
by Friday morning on a further weakening
dollar oil almost regained their
losses. At the time of 8.22 MSK Brent
The dollar traded at 55.13
per barrel (May futures), WTI
- for $ 49.53.


Pre
agreement was reached in Switzerland
Lausanne after an eight-day marathon
negotiations. The main impact of this
developments in the markets - a potential withdrawal
economic sanctions against
Iran, which ranks fourth
the world's oil reserves. Consequently,
in the long term offer
oil will increase dramatically in the markets. True,
Diplomats close to conclusion
negotiations, noted that the agreement
very fragile and do not exclude that until 30
June deal could fall apart.


Under the terms of the framework
agreement, Iran will have to stop
its production of enriched uranium, dismantle
plutonium reactor and provide
maximum transparency of its nuclear
for international observers program.
Barack Obama has promised that "control
It will be unprecedented. "


Related posts


  • In developing markets new headache


    In developing markets , a new headache: cheaper commodities In emerging markets for today time was more than enough problems. Suffice it to mention at...


  • Speculators increasing their short


    Speculators increasing their short positions in Brent After rising by more than 50% in the period from February to March, the oil is rapidly becoming...


  • Engines markets major events of


    Engines markets: major events of the week The key economic data this week will be the figures of inflation and the US housing market . It is also...


Next posts


  • Oil continues to fall in price

  • Asian markets ended day in green

  • Greek minister predicted collapse

Batman

Batman Batman Advisor is based on a very simple system that uses ZigZag indicator and breakdown strategy. Transactions are opened only whe...