Friday, September 28, 2018

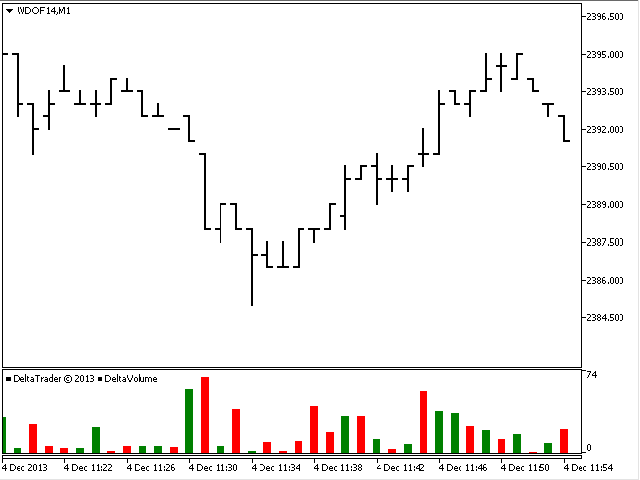
DeltaID5 R002 DeltaVolume

DeltaID5 R002 DeltaVolume


Indicator inspired by the famous graphic MarketDelta. The indicator calculates the difference between the transactions committed on bid price and ask price, and transactions made at prices within bid and ask, considered as non-market impact.


value indicator shows the net difference between the volume of transactions carried out on the bid price and the volume of transactions carried out on the ask price, these transactions have a significant impact on price movement.


You can create trading systems and strategies using the "traditional" indicators with DeltaVolume indicator. In other words, you can use DeltaVolume, to "follow" other traders and "acknowledge" signals of the trading system by analyzing the actions of other traders.


In fact, with the indicator DeltaVolume you can see order flow, exposed to the market, and trade with it accounting.


  • Attention: this indicator will not work with most Forex brokers, as they usually do not convey information about the price of the last transaction (for bid / on ask / costs between them).

  • Warning 2: this indicator will not work in the strategy tester (as far as I know, even in the "Every tick").

  • Warning 3: you can easily check whether you are getting the correct price bid / ask / last; 1) open market review; 2) Click on any symbol and then on the "Tiki" at the bottom; 3) press'B''A'And'L', Then you should see three lines (red, blue and green); 4) Make sure that the green line is present, and, most importantly, that it is constantly moving between the red and the blue line; If the green line is missing, or it constantly coincides with one of the other lines, the indicator will not work on this symbol.


DeltaID5 R002 DeltaVolume

Video


Related posts


  • VolumeDeltaMT5


    VolumeDeltaMT5 This indicator allows you to analyze the delta tick volume. It calculates each bar tick volume of purchases and sales (separately), as...


  • Elder AutoEnvelope


    Elder AutoEnvelope Envelopes (Envelopes) or channel lines are similar to moving averages (or slow MA with two MA). Inside the channel lines daily...


  • ChannelTrend MT5


    ChannelTrend MT5 Indicator ChannelTrend - is a trading system that allows you to analyze the market in terms of several aspects of technical analysis....


Next posts


  • Pin Bar AHA

  • Average Spread

  • S2 Price Frequency

Wednesday, September 26, 2018

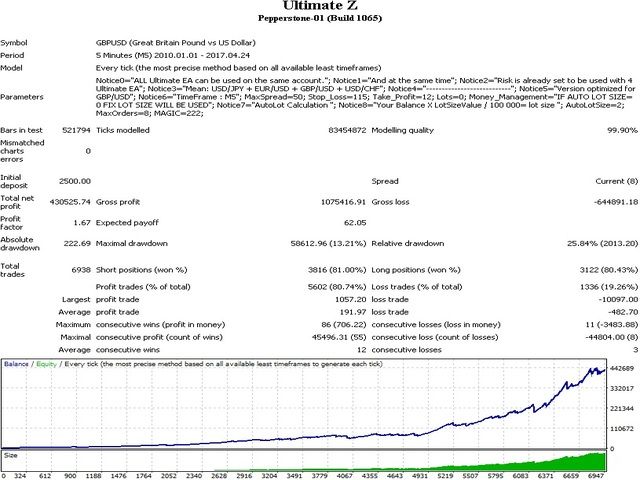
Ultimate Z

Ultimate Z


Recommended pair: GBP / USD


* The "Ultimate" series of products (other advisors recommended for: EUR / USD, USD / JPY, GBP / USD, USD / CHF) can be used simultaneously on one account.


Risk / parameters are already set to be shared with 4 of these advisers.


This strategy is based on a special custom indicators. EA trades with the trend.
It simultaneously uses multiple systems to calculate the best entry points for opening positions.


When performing erroneous entry system close position until the stop loss.


In this system, there are no elements of martingale.


This system not intended for "Fast scalping or studs catching." It can run on a personal computer and the VPS-server. (It is recommended to use cloud hosting or a regular VPS. They provide more stability than a home computer.)


Recommended timeframe: M5


settings


Advisor works with fixed spread and ECN accounts.


Advisor has built-in protection from price spikes during the news release. EA can work around the clock 7 days a week, he will not open positions on the heels of news.


  • MaxSpread - the maximum spread (in points) for the open positions.

  • Stop_Loss - stop loss in pips.

  • Take_Profit - Take Profit in pips.

  • Lots - the size of the manual / fixed asset. Set to 0 to turn on the automatic calculation of the lot size.

  • AutoLotSize - avtolota size. Calculated as follows: "Your balance" X "Auto Lot size Value"? 100 000 = lot size.

  • MaxOrders -the maximum number of warrants that can open adviser.

  • Magic - magic number for tracking orders advisor.


Ultimate Z

Related posts


  • Trend Runner


    Trend Runner Forget about spending all day in front of his computer, the adviser will help you enter into long-term trends, it will detect the beginning...


  • Mr Haas Robot


    Mr Haas Robot Mr Haas Robot - fully automated Forex-Advisor. The strategy is based on the breakdown of price levels using intelligent stop-loss and take-...


  • Price move


    price move Shopping Advisor is designed to trade on USDJPY H1. input signals generated based on Price Move indicator . The volume of transactions - 2% of...


Next posts


  • Quantum

  • GRaudusd

  • AccelerationExperts

Heiken Color Indicator

Heiken Color Indicator


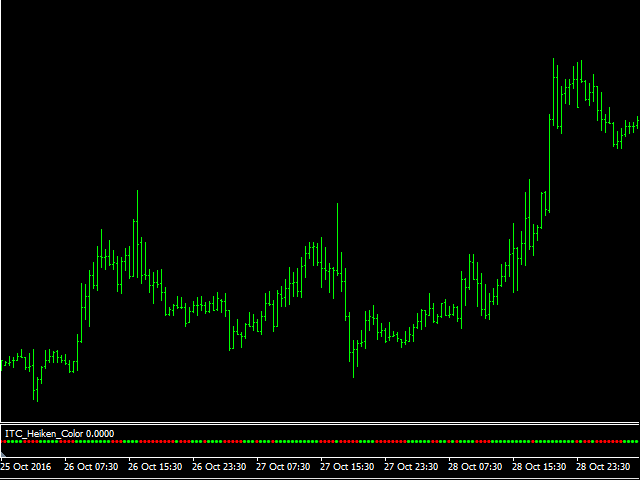
Heiken Color - simple indicator showing candles Heiken Ashi color in a separate window.


This is useful if you want to use Heiken Ashi indicator, without changing the settings displayed on the main chart.


Heiken Ashi can be used to filter the detection signal or the most appropriate entry point after the appearance of the indicator signals.


There is no indicator of the input parameters.


Heiken Color can be used on any time frame with any asset: Forex, stocks, commodities, futures.


We recommend to use Heiken Color for the following indicators available in MQL5 Market:


  • BinaryG: https://www.mql5.com/ru/market/product/18697

  • BinaryMagic: https://www.mql5.com/ru/market/product/18698

  • BinaryReversal: https://www.mql5.com/ru/market/product/19311


Heiken Color Indicator

Related posts


  • Auto ZZ SR Indicator


    Auto ZZ SR Indicator This indicator automatically draws the trend lines on the upper and lower points of extremum using the ZigZag indicator . As an...


  • RSI Color


    RSI Color This is a simple indicator RSI to extract color values ​​of overbought and oversold. The ability to quickly see such a situation in the market...


  • Harmonic Trading Pro Indicator


    Harmonic Trading Pro Indicator Harmonic Trading Pro Indicator is unlike any other one harmonic light in the market . This harmonic light has a very...


Next posts


  • Breakout Range

  • Return Price Bar

  • Price Channel Notifier MT4

Tuesday, September 25, 2018

As gold affects currency rates

As gold affects the currency rates?

Gold is considered as one of the most popular metals in the world, both in the eyes of investors and consumers alike.


Although gold is no longer used as currency in the developed world, it continues to have an impact on the currency markets. Moreover, there is a strong correlation between the gold price and exchange rates.


To illustrate these relationships, the following aspects should be taken into account.


1) Previously, gold was used for the insurance of currencies not backed by gold.


Even in the times of the Byzantine Empire, gold was used as a guarantor
in transactions with different currencies not backed by gold.
Moreover, almost to the end of the XX century, gold played the role of reserve
asset; US used the "gold standard" until canceled
Nixon in 1971


One of the reasons for its use was limited number of countries,
had the right to issue money. This was due to the fact that up
before rejecting the "gold standard" of the government could not print
money not backed by gold.


Although the system of "gold standard" no longer applies in the countries
the developed world, a number of economists believe that it is necessary to return
in connection with a high degree of volatility and other dollar currency.


2) Gold is used in hedging inflation


As a rule, the demand for gold increases with an increase in inflation rates.


Investor interest in gold in this case, due to its self-value and limited supply.


For the reason that gold can not be obtained by artificial means, it
much more stable than the usual currency. For example, in April 2011, when
investors feared devaluation of the official currency, gold price
up to $ 1,500 per ounce. This indicated a low degree of
confidence in the world's major currencies and pointed to the grim economic
prospects.


3) The price of gold is reflected in the situation in countries that import and export the metal.


The course of any currency is closely linked to the export and import figures.
If a country imports more than it exports, public course
currency falls. Otherwise, bucking the trend, and the rate
It is growing.


Thus, if the price of gold increases, the country,
exporting gold or having access to its reserves, exchange rate
the national currency will continue to grow.


In other words, the rise in gold prices may contribute
achieving trade surplus or, at least, will reduce the
deficit.


On the contrary, in countries importing gold on a large scale, the course
the national currency will decline when the price of gold will rise.
For example, countries that specialize in creating jewelry, but
not have their own resources of gold, the gold will be imported.
They are particularly sensitive to a rise in the prices
metal.


4) Buying of gold, banks lower value of the currency is used in the calculations.


Buying gold, central banks influence the supply and demand balance
the national currency, which could lead to inflation. This is largely
due to the fact that when buying gold cans are usually printed
money, increasing the amount of money in circulation.


5) The price of gold is often used in determining the value of regional currencies, but there are exceptions.


Many people mistakenly believe that gold can always be used when
determining the value of the local currency of any country. Although
gold prices affect currency rates, this is not always
There is a clear inverse relationship, as many believe.


For example, the price of gold may rise at a high demand for this
metal in the industry, using it in the production process.
However, it does not talk about reducing the rate of regional
currency, which currently can be quite high.


Thus, the price of gold can be used in the evaluation of the course
dollar, but to determine whether the inverse relationship, you must
take all market conditions into account.


conclusion


Gold has a strong influence on the quotations of world currencies. Even
despite the rejection of the "gold standard", gold can be used
As an alternative to paper currencies and protect against inflation.


Undoubtedly, gold will continue to play an important role in the currency markets.
On this basis, we can conclude that gold is
a unique asset that can reflect the state of both regional and
global economies.


Related posts


  • Mysterious currency pairs in Forex


    Mysterious currency pairs in the Forex market Most traders trade the most liquid and of the most popular forex pairs. But while some opt for more exotic...


  • Dovish FOMC minute lifted gold


    Dovish FOMC minute lifted gold to a five-week high at today trading gold rose to the highest level in the last five weeks. K 11.22 MSK yellow metal with...


  • Why IMF took gold


    Why the IMF took the gold? Many analysts recently said that fiatnye currency will soon disappear and will not used as a primary means of payment in the...


Next posts


  • GoPro shares rose by 103% in 4

  • Cluster digital filters

  • On Wall Street everything is calm
Monday, September 24, 2018

Gold futures were down during

Gold futures were down during the Asian session

Tuesday morning
gold futures were down during
trading on Asian markets - division
New York Mercantile Exchange's Comex.

So, gold futures for delivery in
August traded at $ 1.328,50
per troy untsiyu.Skoree all gold
find support at
1.306,80 and 1.333,10 resistance.

The dollar index against
a basket of six other major currencies
unchanged at 0.06% and is trading now
at $ 79.86.


On most Exchange Comex
Silver Index delivery
September changed by 0.33% and traded
at $ 21.125 per troy
ounce. Copper for delivery in the index
September changed by 0.06% and trading
to $ 3,207 per pound.


Related posts


  • Gold goes lower and lower


    Gold goes lower and lower Again, the Asian session, there is decline in gold futures prices. Thus, in the division of the New York Mercantile Exchange,...


  • Gold moved down and is held in


    Gold moved down and is held in the neighborhood of $ 1185 under pressure from the Fed , China and Greece quotes Gold on Tuesday froze in the zone where...


  • Gold becomes cheaper to British


    Gold becomes cheaper to the British referendum on EU membership LONDON (Reuters) - Gold is cheaper on Tuesday amid fears of cooling that the UK will vote...


Next posts


  • As gold affects currency rates

  • GoPro shares rose by 103% in 4

  • Cluster digital filters

Friday, September 21, 2018

Forecast financial markets on

Forecast financial markets on Friday: what the outcome of this week?

In Portugal, the coming financial stress in the euro next test of strength, gold rises in price, and even oil crept up.


Next week, large corporations will begin to publish their reports. The US stock market is now trading at all-time highs. Expectations for company profits is very optimistic: the majority of the companies included in the pool of S P 500, according to analysts, have added an average of 6.6% during the quarter.


However, some problems
expected in the financial sector: The Fed
has already announced that turns its
program to support the economy, and
rate hike, apparently, are not for
mountains. All this will surely affect
on the banking system. The problems began,
for example, JP Morgan Chase, and
they are caused by a complex of factors.
At the company's CEO,
Jamie Dimon, the big problems
health, but still there is a danger
trial on charges of
violation of sanctions (in complicity with
notorious BNP Paribas).
In short, if you have the stock JPM
- better sell them.


Commodity
panic markets around the Portuguese
bank Banco Espirito Santo leads
to the fact that gold grows well, the goal
$ 1341 per troy ounce
achieved, and experts expect a continuation
rising to $ 1,350 an ounce. A
Now the price of oil, reaching its
minimum, began to grow, and today
analysts put as a target for Brent
point 109.70.


Concerning
the foreign exchange market, the purpose of the pair EUR / USD
estimated by analysts as 1.3640 -
further growth of the euro have not yet seen.
GBP / USD slowly begins
fall, and experts predict a breakdown
below 1.70. The deficit in the United Kingdom
increases and economic growth reached
its maximum. It's time to go
the podium, ahead of correction. Couple
USD / JPY continues to be
under pressure, analysts advise
enter it on the market Long.


Related posts


  • Forecast for tomorrow levels for


    Forecast for tomorrow - levels for the EUR / USD, GBP / USD, USD / JPY EUR / USD : Konsolidaniya the continuation of the downtrend . Currently, the...


  • Opinion crisis in emerging markets


    Opinion: The crisis in emerging markets - the third wave of global financial crisis downturn in emerging markets - is not just a the result of the local...


  • Engines markets major events of


    Engines markets: major events of the week The key economic data this week will be the figures of inflation and the US housing market . It is also...


Next posts


  • Gold futures were down during

  • As gold affects currency rates

  • GoPro shares rose by 103% in 4

Thursday, September 20, 2018

Quantum analysis

quantum analysis

Epic quantum analysis began around 2000, when the native of St. Petersburg Andre Duka published his work "The general theory of evolution"In which the author strictly mathematically and physically shown that all dynamic processes in our universe are subject to quantum mechanical hook zakonam.Glavnaya quantum analysis proposed A.Duka - quantization trajectory market movement on price and time shkale.V this theory, the fundamental point is equality of price and quantum of time and the transition to the new space, which the author called the space Duca.


Related posts


  • DollarRuble Technical Analysis


    Dollar / Ruble (USDRUB) Technical Analysis - multidirectional correctional movement to the support level of 53.02 On day timeframe price is the primary...


  • EURUSD general analysis


    EUR / USD: general analysis Current trend The single European currency slightly weakened position against the US dollar during the trading session on 23...


  • Analysis of some currency pairs


    Analysis of some currency pairs EUR using the Fibonacci instrument line 1993 Robert Fischer issued in "Wiley and Sons," a book tentatively titled...


Next posts


  • Forecast financial markets on

  • Gold futures were down during

  • As gold affects currency rates

Wednesday, September 19, 2018

BigTrendTrapSignal

BigTrendTrapSignal


BTT is a trend indicator signal indicator. The algorithm is based on the principle of price movement - a trend to roll back - the entrance. The indicator gives a signal to enter the market and signal to the partial or total orders fit. The indicator works on all timeframes, and with almost all the instruments.


The indicator does not draw or delayed

The indicator can not be considered independent trading system. When passing the flat there are losing trades, that is more than compensated with lovlennym trend. In addition, filters are required for it. In particular, I use MA. In all of this, the indicator gives a huge percentage of correct signals and helps to catch a lot of traffic.


Trading Strategy (Recommendations for use)


Short-term:


  • Enter the market, when the MA formed and BTT trend indicator gives a signal (arrow) to enter the market.

  • Exit the market when BTT indicator gives a signal (arrow) on the order fixation.

  • Only the first work formed of motion signals.


Long-term:


  • Enter the market when MA changing trends and BTT indicator gives a signal (arrow) to enter the market.

  • When the signal at the fixation / partial order fixation - close the portion of the order, to the residue accompany the return signal. Signals on new refill indicator BTT short stop.


Feet:


  • Nearest minimum / maximum.

  • Reverse indicator signal BTT + reverse patern MA.


Additionally:


  • Indicator perfectly complements the work with trend lines, lines of support / resistance.

  • Not trade before the release of significant news (1 hour before and 1 hour after). Do not trade during high volatility.

  • Do not forget to transfer without loss and trail the stop.


settings


  • Big_Trend_Trap_Intensity = 4; - Calculation period / the number of bars to calculate the indicator

  • sell_level = 0.99; - sell_level / level for SELL

  • buy_level = 0.01; - buy_level / level BUY

  • sell_level_trend = 0.93; - sell_level_trend / level for SELL

  • buy_level_trend = 0.07; - buy_level_trend / level BUY

  • Sound = true; - Sound / audio notification

  • alert = true; - alert / notification of the alert window

  • SoundFileBuy = "alarm.wav"; - SoundFileBuy

  • SoundFileSell = "alarm.wav"; - SoundFileSell

  • SoundFileCloseBuy = "alarm.wav"; - SoundFileCloseBuy

  • SoundFileCloseSell = "alarm.wav"; - SoundFileCloseSell

  • Cod_Arrows_SUp = 71; - Cod_Arrows_SUp / arrow code signal buy

  • Cod_Arrows_SDn = 72; - Cod_Arrows_SDn / Kostrelki signal sell

  • Cod_Arrows_SUp2 = 34; - Cod_Arrows_SUp2 / arrow code signal buy

  • Cod_Arrows_SDn2 = 34; - Cod_Arrows_SDn2 / Kostrelki signal sell

  • DnColor = clrGold; - DnColor / color arrow SELL

  • UpColor = clrSpringGreen; - UpColor / color arrows BUY

  • DnColor2 = clrGold; - DnColor2 / color arrow SELL

  • UpColor2 = clrSpringGreen; - UpColor2 / color arrows BUY

  • Arr_Dist_DN = 30; - Arr_Dist_DN / distance for arrow Dn

  • Arr_Dist_UP = 30; - Arr_Dist_UP / distance for the Up arrow

  • Arr_Dist_UP2 = 40; - Arr_Dist_UP2 / distance to stops Up2

  • Arr_Dist_DN2 = 40; - Arr_Dist_DN2 / distance to stops Dn2

  • Arr_width = 1; - Arr_width / arrows Thickness

  • Arr_width2 = 1; - Arr_width2 / arrows Thickness

  • Normalize = 1; - Normalize / rounding calculations

  • delta1 = 450; - delta1 / delta divergence MA

  • delta2 = 250; - delta2 / Delta to calculate the probability of regression

  • ExtPeriodFastMA = 96; - ExtPeriodFastMA

  • ExtPeriodFiltrMA = 128; - ExtPeriodFiltrMA

  • ExtPeriodSlowMA = 210; - ExtPeriodSlowMA

BigTrendTrapSignal

Related posts


  • Trade On Test


    Trade On The Test Indicator Trade On The Test generates signals for the purchase / sale in the form of up and down arrows on the basis of the found best...


  • OneTM TrendFinder


    OneTM TrendFinder The indicator uses a complex algorithm for calculating the ratio of RSI and moving averages. The values ​​of the RSI indicator is used...


  • HelpLine


    HelpLine Introducing novelty in 2014 - nepererisovyvayuschiysya and easy to use HelpLine indicator for the Forex market . The indicator tracks trends,...


Next posts


  • Heiken Color Indicator

  • Breakout Range

  • Return Price Bar

Pound is preparing to sharp move

Pound is preparing to sharp movements

Pound closed in New York on Tuesday at $ 1.6813 after being unable to continue to recover from early European lows around $ 1.6757 to a maximum of US $ 1.6817 session. This step has been given a boost before and after the London fixing at 1600BST, and the reason was the positioning in anticipation of today's key events, namely the UK labor market report at 0830GMT and review of inflation from the Bank of England at 0930GMT. Pound slowly returned profits in the Asian session, down from opening highs of around $ 1.6813 to $ 1.6801, but again trading around $ 1.6813 this morning in Europe. Euro / sterling also reflected the revival of sterling fell Tuesday below support at stg0.7970, extending the pullback to stg0.7945. Cross held in Asia in the narrow stg0.7951 / 54 range. Reports on major transactions in the show that recent mixed data this morning suggests that the BOE will reflect some cooling in the process of recovery of the UK economy, but the choice of sterling - still a good bet, since the absence of such negative assessments of the inflation report will lead to a sharp rise in the currency. Buying sterling on dips remains the best course of action. Employment data, expected to show further improvement. Pound bidami maintained at 1.6800 $, $ 1.6787-80 (50% -61.8% of the $ 1.6757-1.6817). Resistance is at $ 1.6820-30.

Technical analysis on the GBP / USD

Impedance 4: $ 1.6894 - resistance hour July 31
Resistance 3: $ 1.6880 - the 100-day moving average
Resistance 2: $ 1.6863 - a maximum of 7 August
Resistance 1: $ 1.6828 - hour resistance of August 8
The current rate of the currency pair: $ 1.6823
Support 1: $ 1.6795 - the high of August 11 is now supported
Support 2: $ 1.6757 - a minimum of 12 August
Support 3: $ 1.6738 - a minimum of 11 June
Support for 4: $ 1.6718 - month low on June 4

Comment: after finding support at $ 1.6766 a pound sank to new 2-month low on Tuesday, but rebounded to the initial resistance of $ 1.6828. resistance layers remain in the neighborhood of $ 1.6828-1.6894, and the bulls continue to look at, to close above $ 1.6894. This will confirm the weakening of bearish pressure. Daily oscillators are oversold and are a key concern for the subject bears now. Now they need to see a close below initial support $ 1.6795 to confirm the downside pressure.


Related posts


  • Pound may decline to suspend


    Pound may decline to suspend Pound closed in New York on Wednesday at $ 1.6594 after hitting a low of $ 1.6589 in reaction to the FOMC minute, which were...


  • Pound will rise


    The pound will rise In recent weeks, the UK economy has demonstrated extreme stability and statistics gives a good performance. In late August, there...


  • Forecast for tomorrow levels for


    Forecast for tomorrow - levels for the EUR / USD, GBP / USD, USD / JPY EUR / USD : Konsolidaniya the continuation of the downtrend . Currently, the...


Next posts


  • Quantum analysis

  • Forecast financial markets on

  • Gold futures were down during

Monday, September 17, 2018

Copper rose to four month high

Copper rose to a four-month high on Chinese wave

September
copper futures on unit Comex
New York Mercantile Exchange, while
European morning trade, up
0.25% (up to 3,265 per dollar
lb). The range of traded prices - in
between $ 3,247 and
$ 3,269 per pound. these values
are very close to April
maximum. Most likely, in the near future
while futures support will
is at $ 3.237 / lb
(This is at least 7 July), and the resistance -
to $ 3,294 / pound (this is the maximum
July 8).


such movements
copper due to the publication of data
from China, where consumer inflation
prices rose by 2.3% in annual terms.
In this case, price inflation proizvoditeleyupala
1.1% (it is more
0.1% predicted). these data
quite positive, and given the fact that
China consumes 40% of global copper, then
Copper futures on the statistics from
Celestial is also, of course, influenced.


Related posts


  • Gold rose but apparently not for


    Gold rose , but apparently not for long Today prices gold goes up. Now (at 13.30 MSK) It is trading at 1 200.40 USD per troy ounce, gaining 0.29% on the...


  • US stocks rose on Monday


    US stocks rose on Monday, stock US stocks rose on Monday, the expectation that the Fed will be forced to offset concerns about surprisingly weak report...


  • Gold goes lower and lower


    Gold goes lower and lower Again, the Asian session, there is decline in gold futures prices. Thus, in the division of the New York Mercantile Exchange,...


Next posts


  • Pound is preparing to sharp move

  • Quantum analysis

  • Forecast financial markets on

Friday, September 14, 2018

Hunter delete

Hunter delete


Script - Remove Hunter


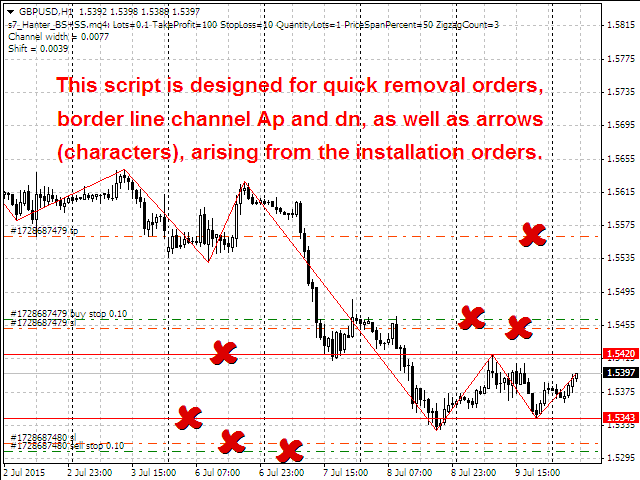
This script is designed to quickly remove pending orders, the channel boundary lines Up and Dn, as well as arrows (symbols) that arise when installing warrants.


Capabilities:


  • Maybe at one time to delete all pending orders of the current chart

  • Maybe at one time to delete all pending orders of the current account

  • Can remove only a predetermined order number (Sorcere)

  • Can remove the lines indicating the boundary of the channel, levels of support / resistance of the symbols Up and Dn

  • Can remove all the arrows (symbols), remaining after the installation and removal orders


Using:


Drag the chart title of the script of the navigator pane in the Preferences window that appears, enter the required parameters.


Do not forget to check if trading is allowed - must also be checked in the second tab. Otherwise, the order will not be deleted!


Customizable options:


  • Only current symbol = true - delete pending orders only current character, false - all pending orders in current account

  • Only this magic - true = delete pending orders only a predetermined number, false - pending orders with any number (Sorcere)

  • Magic number = order number to be deleted (Magik)

  • Remove line Up, Dn = true - remove the line Up and Dn, false - no

  • Remove arrows = true - remove arrows, false - no


A comment:


The script displays the following comment in the upper left corner of the active chart:


  • script name

  • the number of closed otlozhennikov (No symbol)

  • or the number of closed otlozhennikov (all instruments)


Using:


The script can be used to delete a pending order, exhibited the following advisors and scripts:


  • News Hunter Bot OneTime

  • Hunter on the channel breakout BuyStop SellStop

  • Hunter on the channel breakout BuyStop

  • Hunter on the channel breakout SellStop

  • Hunter on the channel breakout BS SS DEMO


signal lines Up, Dn can be used by an expert tool The signal at the sample channel to alert the trader calculated intersection of the channel.


Hunter delete

Related posts


  • Copy Trader MT4


    Copy Trader MT4 Copy Trader - a convenient and fast copier orders for MetaTrader4. Advisor performs copying orders of terminal - server to one or more...


  • CloseAllSymbol


    CloseAllSymbol Closing all the character of orders , which is cast on the chart. Before running the script, allow auto trade . Related posts History...


  • Close Positions Delete Pending


    Close Positions Delete Pending Orders Description: This script is used to relieve one or more pending oredrov or closing one or more positions. Enable...


Next posts


  • Trend direction

  • Forex Correlations

  • Pearl Diver

Thursday, September 13, 2018

Rhino Scalp

Rhino Scalp


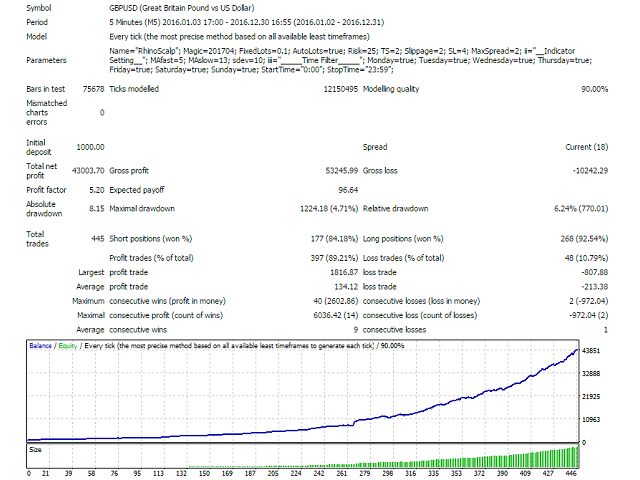
Rhino Scalp - Advisor is a fully automatic, based on divergences of moving averages and standard deviation indicator.

The algorithm calculates the divergence between the two moving averages, and then applies the power of the standard deviation for transactions.


Advisor can be used for any timeframe, but it is recommended to run on the graph at low M5 spreads and low commissions.


Input parameters


  • Expert Name - advisor name and comments to transactions.

  • Magic Number - advisor magic number to identify transactions.

  • Fixed Lot Size - fixed lot size.

  • Activate Auto Lot Size - If true, activate the automatic calculation of the lot size.

  • Auto Lot Risk (%) - the risk for the calculation of the automatic lot size.

  • Trailing Start - distance in pips to include trailing.

  • Slippage - slippage.

  • SL - stop-loss.

  • Max Spread Allowed - maximum spread above which the adviser does not trade in Buda.


indicator settings


  • MA fast Period - during the fast moving average.

  • MA slow Period - period of slow moving average.

  • Standard Deviation Period - standard deviation indicator period.


Temporal filter:


  • Weekly days - Specify true for trading on that day.

  • StartTime - start time adviser.

  • StopTime - the close of the advisor.


recommendations


  • Volatile currency pairs.

  • Low spread.

  • Low commissions.

  • Leverage - at least 1: 200

  • Five-digit quotes.

  • Hour virtual hosting (VPS) with low latency.


Rhino Scalp

Related posts


  • Aggresive Silence


    aggresive Silence Purpose: Automation of trade and commercial transactions in the Forex market through MetaTrader 4 trading platform (MetaQuotes Software...


  • Aero Swing


    Aero Swing This EA is based on the detection of the trend with four moving averages, RSI indicator, MACD indicator and the indicator WPR. The order is...


  • Harvest cabbage


    Harvest cabbage ea_Harvest Cabbage - Advisor intended for trading on currency pairs EURUSD and GBPUSD H1 timeframe. Advisor does not use Martingale...


Next posts


  • Ultimate Z

  • Quantum

  • GRaudusd

Portugal not biggest problem in

Portugal - not the biggest problem in the Eurozone. Italy's all my fault!

Saymon Nikson, the chief of department of European observers Wall Street Journal, says that the Portuguese economy - not so gentle castle in the air, what may seem. This castle will stand in the face of problems with BSE.


But what should really worry investors - so it is slowing the recovery of major economies of the Eurozone. Adapted translation of his article, I bring to your attention.


Not so bad in Portugal

A few days
last week showed solid
deja vu on all fronts. Sword of Damocles,
hanging over the Portuguese bank,
I scared the whole European market. fell
stocks, bonds spreads
peripheral countries widened and
Spreads for the major European economies
- on the contrary, suzilis.Prizraki that
more recently we wandered through Europe,
again began to frighten investors it
the fragility of the European banking system and
risks of its instant infection
in the case of local problems.


It would seem,
Many argued that the fluctuations of the market
expected for a long time. Flows of money that
wide rivers flowing to Europe for
this year, was simply extraordinary.
market doors were wide open for
each government, each
bank. Own bonds issued
even Cyprus, and its largest bank steady
It stands in the way of rise in price of shares. European
high-yield bond market is
in full blossom. All this clearly
signals: investors underestimate
risks that still teem with dark
corners of the eurozone, but in the meantime the regulator
has adopted a policy that
more and more encouraging investors
to take these risks.


A heavy blow,
which overtook Banco Espirito Santo,
perhaps prompted many investors
take the money off the table and stop
game. Portuguese bank controlled
through a cascade of family holding
companies, and it has come under a lot of pressure,
when financial problems were revealed
not so much from him, how much
his "pope" - the company Espirito
Santo International, a giant with a variety of
interests around the world.

Portugal not biggest problem in


The situation in
BES now!
It looks much better than all of fright
It appeared last week. his contributions
other "parent" units
Holding up 1.1 billion euros. And this
in the context of the 100 billion balance and
shares at € 7 billion (up 2.1 billion
exceeds the regulator
minimum). Even if the worst develop
scenario - BES
comes under pressure
to comply with the guarantees given by the holder
its controlling interest to buyers
shares, the amount of liabilities increased
to 700 million euros (up 1.8 billion) - that no one,
certainly not be pleased, but the bank will stand.
Of course, this confusion and vacillation
will be painful for shareholders,
who now lull their toll on
newly bought shares. However,
Government has an additional 6 billion euros
anti-crisis reserve, designed
to recapitalize the banks, and that,
in principle, able to fill any
shortages.


With all of this
experts still see no reason,
on which problems in BES
should cause long-term
difficulties for Portugal. The country has
sees profits and benefits from a long-term
reform program. Economic growth in this
year, is expected to be above average
in the euro area by 1.2%, and the next year
It will rise to 1.5%. unemployment smoothly
It moves from its peak of 17.5% down, and
three past quarter went down to 14.3%, which,
in turn, stimulates recovery
households.


bank
system of the country is not confined to one
BES - and believe me, there is also
all in relative order. The second
largest credit institution
Portugal, Millenium BCP, earned
recent Euro 2.25 billion in the production of new
shares. The Portuguese banking system
becomes also the new beneficiary
long-term low-yield bonds
ECB.


In short, on the
Portugal should not worry.

But all is not well in Italy


market experts
consider that BES - not the main
threat to stability even finansovovoy
individual Portugal, not to mention
It mentions the European community as a whole. there are
other risks, which should have been
serious worry investors - and
They may have played a role in the sell-off
last week. What really needs to
excite investors - the fact that,
It seems to stop the growth of the largest
Eurozone economies.


recent releases
indicate a decrease in production
in June in Germany, France and Italy.
Some of these problems can be attributed to
non-systemic factors, including vacation
time and adverse weather
conditions. The crisis in Ukraine could also
impact on German exports. And here
real disappointment due to the
unstable state of the new "sick":
France and Italy. Both of these countries are not
very slow to ensure the reform,
which improves performance
and competitiveness of the economy in
European community. Significantly,
J.P.Morgan that raised the forecast
Spain's growth of 1.5%, reflecting the success of its
structural reforms, and at the same time
Italy reduced the forecast to 0%.

Signor Renzi, get busy!


Given the size of
Italy's economy and its scale
public debt (133% of GDP) -
lack of growth remains a major
threatened European stability
Community. To everyone's concern
many influential politicians and large
investors, the Italian prime minister Matteo
Renzi seems to spend most of
his enthusiasm for lobbying
changes in the rules of the euro area economy,
which would allow Italy to receive
all large loans. Although its direct
the challenge is very different - in
promoting reforms that could
would increase the country's growth prospects.


Took office
in February this year, Signor Renzi very
loudly announced an ambitious 100-day
program that "Italy will change."
The result was rather modest. reaching
not a single of these goals, the period
the program has been increased
ten times - up to 1000 days. The only
significant reform, which is now
It seems more or less achievable to
end of this year - restructuring
rules for selecting members of the National
Parliament. Here, it is clear even
layman: this is not the reform that
will lead the some economic
effects.

Portugal not biggest problem in


We have been promised
far-reaching reform of the state
administration, the judiciary,
government spending, labor market
- but the details have not yet been made public,
and the feeling that Signor Renzi still
He has not fully understand where exactly
he had to move. And while the rhetoric
Italian leader so much at odds
with its activities - investors should
preparing to attack much more
shaky times than it was yesterday, or even
Today.


Simon Nixon. Translation - Odillia.


Related posts


  • Opinion Bear stock market has


    Opinion: Bear stock market has already begun? What to do, if the bull market in stocks has ended, just no one noticed? Such question asks Andrew Laptorn...


  • Welfare independent Scotland entirely


    Welfare independent Scotland entirely dependent on five factors The Scottish economy is in itself far from the riches of deposits or the abyss of despair...


  • High frequency trading interview


    High frequency trading - an interview with Haim Bodek Haim Bodek - an extraordinary figure for the financial world. After receiving a bachelor's degree...


Next posts


  • Copper rose to four month high

  • Pound is preparing to sharp move

  • Quantum analysis

Wednesday, September 12, 2018

TR Breakout Patterns Scanner

TR Breakout Patterns Scanner


This price action indicator automates detection the breakdown of the trend patterns and patterns re-breakdown testing, and delivers the signals to the input levels with precise stop-loss (SL) and take profit (TP1 and TP2).


This indicator, supplying signals to technical analysts and traders price action that can "set and forget"! recognition of the principle of candlestick patterns and quantitative analysis of the signals is based on the author's algorithm.


Analysis of price movements may form the basis of successful trading strategies for all types of traders, since it considers the interaction between supply and demand over time. Thus, the strategy of this indicator works exactly the same way when you install on any time frame and financial instruments (Forex, stocks, indices, commodities, etc.), the graph of which he is working in the platform MetaTrader 4. However, it works best during periods of activity of the instrument on the market.


  • Skalpingovaya trade: replace the fifth-minute timeframe.

  • Intraday trading: install the 15-minute / 1-hour timeframe.

  • Swing trading: Set on 4-hour / day timeframe.

  • Long-term trade: set for weekly / monthly timeframe.


The demo version of the indicator for real-time testing can be downloaded here.


Main advantages


  • The indicator takes the shopping signals with a high ratio pips to take profit and stop-loss (which can be set not less than 1: 1) as the input levels, the stop-loss and take profit, and sending alerts, and push-notification when achieving any of these levels.

  • It is not redrawn. Vending signal is removed after breaking the input level, so real-time monitoring / sale may be effective.

  • This lamp is suitable for both professional and beginner traders, since it eliminates the time, cost and effort to analyze the trading signals on the price action.

  • It provides a clear and simple display of patterns, which can easily be used to track and trade.


Options


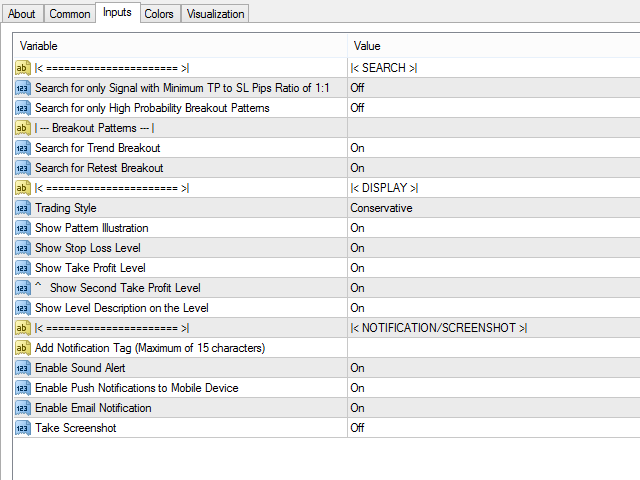
  • SEARCH - Searching

    • Search for only Signal with Minimum TP to SL Pips Ratio of 1: 1 - searches only signals with a minimum ratio of pips TP and SL, is 1: 1.

    • Search for only High Probability Breakout Patterns - Search patterns with only a high probability of breakdown.

    • Search for trend - search trend breakout patterns.

    • Search for retest - search re-breakdown testing patterns.


  • DISPLAY - Displays

    • Trading Style - Trade Style:

      • Very Aggressive - Aggressive = Very aggressive stop loss + aggressive take profit.

      • Aggressive - Aggressive = conservative stop loss + aggressive take profit.

      • Conservative - Conservative = aggressive stop loss + conservative take profit.

      • Very Conservative - Very conservative = conservative stop loss + conservative take profit.


    • Show Pattern Illustration - show patterns illustration.

    • Show Stop Loss Level - show the level of stop-loss.

    • Show Take Profit Level - show the level of take-profit.

    • Show Second Take Profit Level - show the second level take profit (if 'Show Take Profit Level' = true).

    • Show Level Description on the Level - show the level of description.


  • NOTIFICATION - Notification

    • Add Notification Tag (maximum of 15 characters) - add custom tags in the notification (up to 15 characters).

    • Enable Sound Alert - allow sound signals.

    • Enable Push Notification - allow the sending of notifications to the mobile terminal MetaTrader 4. In the terminal, open the "Tools" menu -> "Settings" -> "Notifications," make sure it is checked in the "Enable Push-notification", and enter the MetaQuotes ID (MQID) your "MetaTrader 4" mobile terminal (located under "Settings" -> "Messages") to get notifications directly on your mobile device.

    • Enable Email Notification - turn on email alerts.

    • Take Screenshot - save screenshots. Screenshots are saved in: MQL4 \ Files \ TR Breakout Patterns Scanner (in the Terminal menu, click "File" -> "Open Data Catalog"):


Recommendation


Set the indicator on shared hosting, to always get instant trade signals with the help of push-notifications on the MetaTrader 4 terminal on your mobile device. Detailed description of the virtual host configuration is available in video on link.


TR Breakout Patterns Scanner

Related posts


  • Double Top Scanner For Multi Pair


    Double Top Scanner For Multi Pair And MTF The indicator was developed by the former employee of the hedge fund, and it automatically detects the pattern...


  • Advanced Trend Scanner


    Advanced Trend Scanner Advanced Trend Scanner identifies major trends and their reversals by using the blue and red lines and white arrows. Our tools can...


  • Harmonic Trading Pro Indicator


    Harmonic Trading Pro Indicator Harmonic Trading Pro Indicator is unlike any other one harmonic light in the market . This harmonic light has a very...


Next posts


  • BigTrendTrapSignal

  • Heiken Color Indicator

  • Breakout Range

Tuesday, September 11, 2018

Oil futures stably reduced Monday

Oil futures stably reduced Monday

Crude oil futures have changed little in price, they are traded at four-week lows. While concerns about supply disruptions from the Middle East is not observed.


During European morning trading on the ICE exchange in London, Brent crude for August delivery fell to a low of $ 110.46 per barrel (the weakest level since June 12). On the New York Mercantile Exchange WTI crude for delivery in August also reached a low of $ 103.73.


Results of the last
weeks in a tense situation in Libya:
the rebels have agreed that open
two ports for oil export. Now
These terminals can be exported to
560 th. Barrels of oil per day, which is almost
half of exports oil from
countries.


But at the same
while oil prices decline in the
recent sessions - contribute to this
News from Iraq: in the southern part of the export
Oil will not suffer from the violence that has engulfed the
the northern part of the past week.


Now
investors await key economic
data from China and the United States to evaluate the
the health of the global economy. reports from
China shall publish on Wednesday
(On consumer inflation data
price), and on Thursday will report on trade
balance sheet.


Related posts


  • WTI crude oil fell below $ 100


    WTI crude oil fell below $ 100 on the call against the demand Thursday afternoon oil futures West Texas Intermediate (WTI) fell below $ 100, since as...


  • US stocks rose on Monday


    US stocks rose on Monday, stock US stocks rose on Monday, the expectation that the Fed will be forced to offset concerns about surprisingly weak report...


  • To hedge market you can use futures


    To hedge the market , you can use futures and options novice traders often think, what is needed are financial instruments such as futures Options. Can I...


Next posts


  • Portugal not biggest problem in

  • Copper rose to four month high

  • Pound is preparing to sharp move

Monday, September 10, 2018

Gloomy predictions of Bundesbank

Gloomy predictions of the Bundesbank

Rates of growth
economy in the euro zone slowed down dramatically
and obviously did not make it to the forecast for 2014
year, according to estimates of the Central Bank of Germany.
In France, the stagnation in Germany fell
GDP for the first time since 2012, the ECB is under
pressure, external political situation
APB, mutual sanctions of the West and Russia
also do not add to the magic - all this
led to the fact that the economy of the Old
Light goes deep underground.


decrease
ECB interest rates hit a record high, and low cost
loans - also, and it is justified, but
It leads to overheating market of the finance and
property. European governments
also in no hurry to introduce reforms
economy. The second quarter was a disaster
for all, and a third is expected to be slightly
better.


Related posts


  • Dollar strengthened kiwi and Aussie


    The dollar strengthened , kiwi and the Aussie rose On Thursday, the dollar He wins back the lost positions on Thursday. By 11.20 MSK EURUSD dropped to...


  • Betting on bet


    Betting on a bet. EURUSD R4 1.1330 daily high September 1 R3 1.1260 daily high August 31 R2 1.1240 daily high September 3 R1 1.1230 daily maximum 8...


  • Negative interest rates mean that


    Negative interest rates mean that the Bank of Japan is the currency war - Kuroda TOKYO (Reuters) - The Central Bank is not engaged in a currency war,...


Next posts


  • Oil futures stably reduced Monday

  • Portugal not biggest problem in

  • Copper rose to four month high

Friday, September 7, 2018

Premium Moving Average EA

Premium Moving Average EA


Advisor Premium Moving Average trades using the moving average. Advisor can trade fixed lot or apply money management. If set to 0 the lot, the EA will independently compute the lot size based on the percentage value of the corresponding parameter, to trade a certain risk. If the option to specify a different value of the lot, the EA will trade the specified fixed lot. Advisor for trading EURUSD timeframe with H1. Capabilities:


  • The opportunity to choose a fixed lot size. To do this, you need to specify in the configuration of the lot is greater than 0. By default, the lot size is 0.1. You can also specify 0 for dynamic lot

  • The lot size will be calculated in this case automatically

  • Advisor uses the take-profit and stop-loss set forth in the code

  • Automatic risk management when lot size = 0

  • The recommended account size of $ 500


Test Advisor using forward-period data from 2015 to mid-2016.


Premium Moving Average EA

Related posts


  • Moving Average Cross


    Moving Average Cross adviser Moving Average Cross It is a classic trend advisor. It is working on a real account with any broker any method of execution...


  • GND Average Price


    GND Average Price Advisor is based on a grid strategy and is designed to detect strong trends. It can also be operated at full speed with a minimal...


  • Forex Moola Fibonacci


    Forex Moola Fibonacci Expert Forex Moola is based on the grid patterns of trade . He in turn opens the position to buy and sell, and therefore does not...


Next posts


  • Rhino Scalp

  • Ultimate Z

  • Quantum

Thursday, September 6, 2018

Fast Switching Symbols Periods

Fast Switching Symbols Periods MT5


The indicator allows to quickly switch from one instrument to another, from one time period to another.


This will help you to use the maximum number of instruments from the list of your broker, to analyze in less time increasing the number of tools / periods.


You can also see information about the current instrument: spread (in real time), swap, swaprollover3day, stoplevel, freezelevel.


Description of the buttons on the screen


  • Move to create buttons - buttons can be attached anywhere on the graph, moving the inscription.

  • New List - creates a new list, the tool follows the order (on the list of market survey) and switch to the new sheet.

  • Info Symb - opens a panel with information about this tool:


    • FreezeLevel - the level of freezing orders in points;

    • StopLevel - the distance from the price in points, which can not be set closer to the warrant;

    • Spread - (Spread is updated in real time);

    • Swap - long / Short;

    • SwapRollOver3Days - day triple charging Swap.


  • Symbol- - switches the instrument on (specified in the list, market survey) following the order from the bottom - up (if the instrument first, then switches to the last, so there is a switch in a circle).

  • Symbol + -switches the instrument on (indicated in the list of the market survey) following the order from the top - down (if the instrument is the latter, then switches to the first one, so there is a switch in a circle).

  • Period- - It switches the time period from the largest to smallest (month - minute).

  • Period + -switch time period from smaller to larger (minute - month).


settings


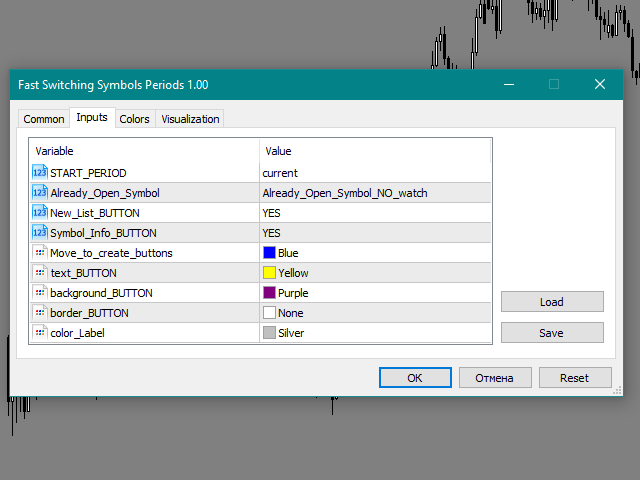
  • START_PERIOD - time period, which offers new tools (by clicking Symbol + Symbol- New_List).

  • Already_Open_Symbol - if the value is NO (when pressed Symbol + Symbol- New_List) and if the next tool to be opened, but it is open at what the other sheet, it will not be opened and will be opened next following.

  • New_List_BUTTON - hides and reflects New_List button.

  • Symbol_Info_BUTTON - hides and reflects Symbol_Info button.

  • Move_to_create_buttons - the color of the text that you want to move to a place where the user wants to place a button.

  • text_BUTTON - the color of the text in the buttons.

  • background_BUTTON - the background color of the buttons.

  • border_BUTTON - frame color buttons.

  • color_Label - color signatures on the graph of the current character / time period.


Fast Switching Symbols Periods

Video


Related posts


  • Qautoactivation


    Qautoactivation Indicator qAutoActivation - one of the main components of the trade expert panel Trading Chaos Expert. The indicator visually shows on...


  • ListConvertToTable


    ListConvertToTable The script converts unsorted list of news feeds macroeconomic data from the calendar of events in a comfortable table where: Each line...


  • RSI on Realtime Deals


    RSI on Realtime Deals At the time of the transaction script records the value of the indicator Relative Strength Index (RSI) and OHLC price bars. For...


Next posts


  • Corporate Report MT5

  • Dashboard Currency Strength Advanced

  • Exp Assistant 5

Wednesday, September 5, 2018

Formula that has changed stock

The formula that has changed the stock market

It's amazing how the existence of mankind depends on mathematics, if one simple little formula can produce the global financial crisis.

Formula that has changed stock

BBC published an article about the formula that has changed the stock market and the blame for the current financial crisis. We are talking about the Black-Scholes model, which is used to evaluate the derivatives and equity finance companies.

Mathematical model of the Black-Scholes model, introduced in the 70s, gave birth to the life of a new financial system based on options trading, futures and derivatives. In this new system, there was nothing from the old classic stock markets. The phenomenal success and widespread formula has meant that Mayron Shoulz received the Nobel Prize in Economics in 1997 "for a new method of determining the value of derivative securities."

Generally speaking, the first futures began to be used in trade in the 17th century, in the Japanese rice market. Traders then began to enter into futures transactions, that is to set the price of the goods, the delivery of which will take place in the future.

By the 20th century on the American commodity exchanges have been in vogue not only futures, but also options - such as an agreement on the price of the future, but without the obligation to carry out the purchase. Options to buy "insurance" by the sharp price increase. Over time, traders have a desire to resell these options, it was difficult, because no one could answer the question: how much are these papers?

For example, how much is the annual option to buy rice at $ 100 at the beginning of the year, when the price of rice is $ 90, or one month before the expiry of the option, when the rice price is the same $ 90? Unknown. Here was born the revolutionary Black-Scholes model, which takes into account market volatility.

The price of the option call:

Formula that has changed stock Where

Formula that has changed stock

Formula that has changed stock

The price of the option put:

Formula that has changed stock

C (S, t) - the current value of call option at the time t until expiry;

S - the current price of the underlying share;

N (x) - the probability that the deviation will be smaller in terms of the standard normal distribution;

K - the exercise price of the option;

r - risk-free interest rate;

T-t - the time until expiration (the period of the option);

Formula that has changed stock - volatility (the square root of the variance) of the basic stocks.

finance professor at Stanford University Mayron Shoulz was fascinated finances since childhood. More little he persuaded his mother to open an account, so that it can trade on the stock market. In 27 years, he was promoted at MIT and, together with his colleague Fischer Black (Fischer Black) seriously took up the definition of a puzzle for options pricing. As already mentioned, the key to unraveling began accounting directly in the formula limit market volatility.

Myron Shoulzm said that after a year and a half working on the formula they've seen elements of options in all objects of the surrounding world.

To the surprise of the authors, Black-Scholes model was used everywhere: in 2007 the volume of trade in derivatives in the world exceeded $ 1 kvardrillion that is ten times the value of goods produced in the history of human civilization. What was all over - it is well known.

Unforeseen changes volatelnosti markets led to unpleasant consequences for the financial markets. Now some experts call this a mathematical model of a "dangerous invention," which unduly simplify such a complex thing as the valuation of assets. The crisis of 1998 showed that a strong change in the volatility happens more often than expected, and therefore all of the assets will have to re-evaluate the new coefficients. Roughly speaking, swollen bubble of the global economy need to sozhit back, even though it means a prolonged recession in developed countries. And all because of the overly simplified mathematical model.

Incidentally, the hedge fund itself Knowles Long-Term Capital Management collapsed back in September 1998, less than a year after receiving the Nobel Prize.


PS Blog Comments there are also interesting.


Related posts


  • Stock Asia traded mixed on Tuesd


    Stock Asia traded mixed on Tuesday Today Asian stock indexes finished mixed. investors doubted the effectiveness of state intervention in the the Chinese...


  • On Moscow stock exchange indexes


    On the Moscow stock exchange indexes appear to help evaluate the effectiveness of state-owned companies According to the press service of the Ministry of...


  • US stock markets closed mixed


    US stock markets closed mixed , Dow Jones added 0.40% The US stock market closed the trading session on Monday in different directions due to the...


Next posts


  • Gloomy predictions of Bundesbank

  • Oil futures stably reduced Monday

  • Portugal not biggest problem in

Tuesday, September 4, 2018

ImpBB

ImpBB


Standard indicator Bollinger Bands (Eng. Bollinger Bands) is calculated based on only 7 price constants and the simple moving average (SMA). This modification makes it possible to count indicator based on any combination of 4-x basic price: Close, Open, High and Low.


An added convenience is a choice of 6-averaging methods: simple (SMA), the exponential (EMA), smoothed (SMMA), linear-weighted (LWMA), double exponential (DEMA), triple exponential (TEMA).


Input parameters:


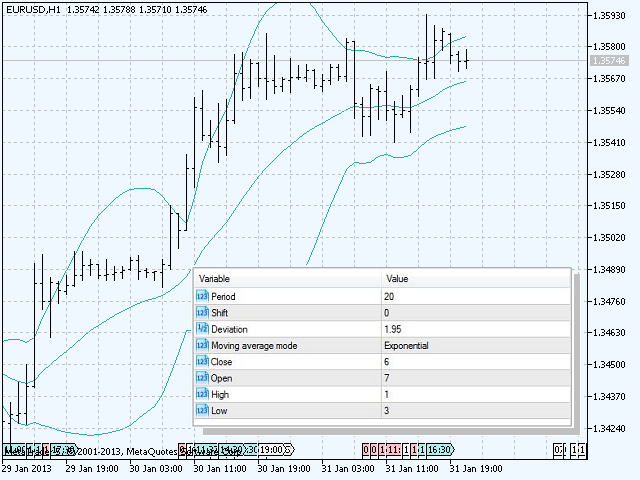
  • Period - averaging period for calculating the indicator;

  • Shift - shift indicator relative to the price chart;

  • Deviation - the standard deviation;

  • Moving Average mode - averaging method: a simple (Simple, SMA), the exponential (Exponential, EMA), smoothed (Smoothed, SMMA), linear-weighted (Linear Weighted, LWMA), double exponential (Double Exponential, DEMA) or triple exponential average (Triple Exponential, TEMA);

  • Close - CLOSE weighted price index to calculate individual prices;

  • Open - weighting OPEN prices to calculate individual prices;

  • High - weighted price index HIGH to calculate individual prices;

  • Low - LOW price weighting coefficient for the calculation of individual price.


Example 1. Calculate the price indicator for OPEN: Close = 0, Open = 1, High = 0, Low = 0.

Example 2. Calculate the price indicator WEIGHTED: Close = 2, Open = 0, High = 1, Low = 1.

Example 3. Calculate indicator on individual pricing constant: Close = 6, Open = 7, High = 1, Low = 3. Price = (6 * Close + 7 * Open + 1 * High + 3 * Low) / 17.


ImpBB

Related posts


  • Extended Keltner Channel MT5


    Extended Keltner Channel MT5 Extended version of the Keltner Channel. You can use a variety of moving average 21 and 11 different prices to calculate the...


  • Moving Average Price Level


    Moving Average Price Level Moving Average displaying price tags. settings Period MA - MA period; Shift MA - displacement of MA; Method MA - smoothing...


  • Rubber tape


    Rubber tape Rubber tape indicator combines trend following indicators and oscillators. The calculation uses the values ​​of the indicator moving average...


Next posts


  • DeltaID5 R002 DeltaVolume

  • Pin Bar AHA

  • Average Spread

Monday, September 3, 2018

SuperTrend Alerts

SuperTrend Alerts


SuperTrend Alerts adds alerts to popular indicators SuperTrend, which follows the trend and therefore works well only with the express trend. SuperTrend widely used in intra-day trading and works on any time frame. Place the call, when the price of the candle closes above SuperTrend line, and put, when the price closes below. These conditions are denoted nepererisovyvayuschimisya up / down arrows.


alerts


It provides audio alerts, alerts in the form of pop-up messages and emails upon the occurrence of specified events below. In the latter case, the recipient's email address and SMTP, you must first set up in MetaTrader 4 settings.


  • Price closes above SuperTrend line (call)
  • The price closes below the SuperTrend (put)


Options


  • # Bars used for calculation (Default = 10): the number of bars to calculate SuperTrend
  • Multiplier (Default = 4.0): a multiplier for calculating the average true range (average true range) in SuperTrend. The lower the value, the more signals, but the greater the likelihood that some of them will be false
  • Alert when price crosses SuperTrend: enable / disable an alert when crossing the line SuperTrend price
  • Turn on alerts message: Alerts as Posts
  • Turn on alerts sound: Sound alerts
  • Turn on alerts email: Alerts via e-mail

SuperTrend Alerts It is most effective during a trend, so it fits well with our other indicator - Choppiness Index indicator.


SuperTrend Alerts

Related posts


  • SuperTrend ATR


    SuperTrend ATR SuperTrend ATR - it is a popular trend indicator is determined by the current projected direction of the market with the help of the data...


  • Veles SuperTrend


    veles SuperTrend The indicator is based on the MA with additional study of all current prices, as well as all the highs and lows for the period. Good...


  • SuperTrend AM


    SuperTrend AM The indicator allows to open a position at the beginning of a significant price movement. Another important quality indicator is the...


Next posts


  • TR Breakout Patterns Scanner

  • BigTrendTrapSignal

  • Heiken Color Indicator

Batman

Batman Batman Advisor is based on a very simple system that uses ZigZag indicator and breakdown strategy. Transactions are opened only whe...