Friday, September 30, 2016

FNA MT4

FNA MT4


Two strategies in one EA!


Simple classic strategy of "breakdown at the level of fractals":


This strategy may be used on the timeframes M15 and above.


Input parameters

  • _point - Away from the level of a fractal in points for placing a pending order;

  • _stopLoss - Stop Loss value in points;

  • _takeProfit - Take Profit value in points;

  • MAGICMA - Magical expert number (Applies to both strategies!);

  • TStop - Meaning trailing stop;

  • TrailingStep - Step trailing stop;

  • DecreaseFactor - Reducing the load on the deposit after losing trades;

  • MaxRisk_perc - The percentage of available funds for the placement of new orders;

  • fixedLots - volume mode selector lots of pending orders (false - sell a percentage of the deposit, true - minimum lot trade);

  • Lot - The minimum lot for trading on a fixed volume of orders;

  • TimeM - time for the start of trading advisor;

  • TimeE - auction end time for the advisor.


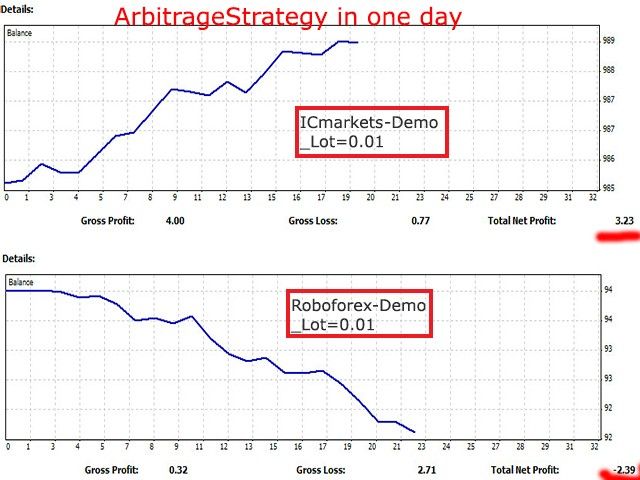
Strategy of "Arbitration" with the ability to conduct operations between two terminals of two different brokers.


Attention! Using the strategy of "Arbitrage" FNA adviser subject to the following conditions:


  1. The broker with whom you work, allows the use of such strategies in its terminal at Demo, and / or on a real account.

  2. two different broker and two MT4 terminal with access to the servers of these brokers need to work counselor in the "Arbitration".

  3. To work correctly, should bear in mind that instances of FNA advisor MT4 two terminals operate in a bundle via a shared folder all MetaQuotes terminals of your computer.

    The path to the shared folder in Windows Terminal 7: C: \ Users \% UserName% \ AppData \ Roaming \ MetaQuotes \ Terminal \ Common \ Files \

  4. During operation, the adviser in the "Arbitration" is unacceptable to change the input parameters of one of the copies of the adviser, installed on schedule. If desired to change the input parameters to unload both copies of the adviser working terminals, and on the next boot set the desired input-parameters.

  5. FNA MT4 advisor author does not guarantee the profitability of the adviser of either of the two strategies you selected, and specifically disclaims any responsibility for the consequences of using FNA MT4 advisor in real trading.


Input parameters:

  • ArbitrageCheck - switch strategies (false-strategy "fractals Levels" true-"Arbitrage" strategy);

  • _symbolFolder - The main character folder for two copies of the Adviser to two different terminals (When installed on the graphics copies advisor, this folder must be empty or absent);

  • folderMain - Folder for the current instance of operations with the current terminal advisor data (must coincide with the folder name "folderAlter" advisor second copy in another terminal);

  • folderAlter - Folder data operations for the second instance of the second terminal advisor (must coincide with the folder name "folderMain" advisor second copy in another terminal);

  • _millisec - integer parameter for the advisor timer;

  • _points - integer parameter profit in points (exposing this option should be considered by the spread symbol kommisiya broker for the transaction and the possible slippage in the open position);

  • MaxSpread - Maximum allowable spread for trading;

  • _Lot - Offer to trade on "Arbitrage" strategy;

  • Limit - switch type place orders (false-market orders, true-limit orders);

  • turnover - Switch-type closing (false-close the transaction on earnings, true-close the deal by the appearance of a return signal to the opening position).


Input parameters of the two copies of the advisor in two different terminals operating in the "Arbitration" (except for the parameters "folderMain" and "folderAlter") must be the same!


Example setup and operation adviser in "Arbitrage," a look at the video.

FNA MT4

Video


Related posts


  • Zone pips


    Zone pips Zone pips - fully automated Forex- Advisor , which uses two types of orders : Buy Stop and Sell Stop. Advisor also uses the system recovery...


  • Robust Trader 20 EAs


    Robust Trader 20 EAs 9 most terrible secrets of scalpers who make you lose money Scalper tested under ideal spreads, i.e. 0.5 or 1.0 pips? Your broker...


  • Phantom


    Phantom Fully automated multi-adviser. Do not apply the martingale, grid trading . For protection use a stop loss. Powered pending orders permitted to...


Next posts


Wednesday, September 28, 2016

Strengthening of ruble creates

Strengthening of the ruble creates conditions to reduce the key rate CBR? Bloomberg

The ruble rose to its highest level in three months against the backdrop of rising oil prices and the "dovish" Fed statements. Strengthening of the Russian currency has increased the possibility of renewed cycle of rate cuts by the Bank of Russia, Bloomberg writes.

The dollar fell against the ruble by 1.32% to 68.25 per dollar as of 17:42 Moscow time against the backdrop of quotes Brent crude three-month high. The ruble has shown the most rapid growth in the last month after the US Federal Reserve reduced its forecasts for interest rates. This fueled investor interest in higher yielding assets in emerging markets.

The Russian currency has become a leader of growth in emerging markets over the past month. The rebound in oil from 13-year low in prices helped reduce fears that the fall of the ruble to a record low in January, acceleration of inflation. The central bank now has space to reduce the key interest rate from 11% for the first time since July, and slowing the growth of the ruble, which is showing signs of overbought, Rabobank analysts believe.

Results of the session of the Russian central bank will be known tomorrow.

"All the focus is on the Bank of Russia, - says Peter Mathis, a currency strategist at Rabobank. - I expect that the regulator will resume the cycle of decline and reduce the base rate by 50 basis points to stop the pace of appreciation of the ruble. "

The 14-day relative strength index reached the ruble to its highest level Thursday October 8th. The value of the index amounted to 68.67, not far from the significant mark of 70. Some technical analysts see it as a sign of overbought asset.

Peter Mathis from Rabobank - one of only seven analysts (among the forty-two surveyed by Bloomberg economists) who expect that at tomorrow's meeting of the central bank lowered its benchmark interest rate by 50 basis points, while more than 70% of traders do not predict any changes .

PS: signals are copied, distributed, and to earn $ https://www.share4you.com/ru/?affid=0fd9105


Related posts


  • Ruble fell in anticipation of


    The ruble fell in anticipation of the Central Bank meeting and amid weak activity Exporters This afternoon, the Russian Ruble reduced trades the currency...


  • Free fall of ruble 69 5 euros


    Free fall of the ruble: 69.5 euros per dollar of 63.5 On Tuesday morning, the ruble It continues to weaken after uncertain behavior on Monday. Play...


  • RUBLE there are chances of growth


    RUBLE: there are chances of growth fundamental base Russian currency still remains under the influence of oil prices. Today, after how the trading...


Next posts


Tuesday, September 27, 2016

Low exchange rate has increased

The low exchange rate has increased the number of tourists in the Russian Federation

Against the background of the devaluation of the Russian currency has increased the flow of foreign tourists in Russia. This was stated by the head of the Federal Tourism Agency Oleg Safonov during a speech at the XI International Tourism Exhibition "ITM". For example, last year the figure rose by 13%.

He noted that on the one hand the fall of the national currency - it is bad, but on the other - it can develop the tourism sector in the Russian Federation.

"To this end, we must be very active," - said the head of department.

Safonov said that tourists mainly come from China and South-East Asia. On a par with this, European citizens come to Russia less than before.

"Again, this is not all! Everything changes, everything evolves, "- he concluded.


Related posts


  • Chinese bankers teach Moscow how


    Chinese bankers teach Moscow how to pay in yuan On Thursday, representatives People's Bank of China and Bank Of China reported in the capital calculation...


  • Ruble fell in anticipation of


    The ruble fell in anticipation of the Central Bank meeting and amid weak activity Exporters This afternoon, the Russian Ruble reduced trades the currency...


  • Pound will rise


    The pound will rise In recent weeks, the UK economy has demonstrated extreme stability and statistics gives a good performance. In late August, there...


Next posts


Monday, September 26, 2016

Mt5 Classic PivotPoints

Mt5 Classic PivotPoints


There are various ways to configure Classic Pivot Points indicator. If you prefer to trade manually and graphics without unnecessary items, you can adjust the display so that it only drew pivots for the current session. Or if you develop a Counselor who uses pivots, the indicator can be configured to display historical pivot.


Another feature of this indicator is that you can set the start of counting the daily pivot. Instead of counting the pivot with the usual time period between 00:00 and 23:59, you can set its start time counting for each day. For example, if you select 17:00 as the start time indicator will count reversals in view of the bar opened at 17:00, as this will be the time of opening the afternoon session, and the bar at 16:59 (the next day) as the bar closing of the day.


It is possible to show / hide the pivot values ​​in the data window.


Input parameters of the indicator:


  • SetTimeFrame - setting a timeframe, which will go counting pivot.

  • ShowValuesInDataWindow - dependent on the true or false in this parameter is governed by mapping historical reversal values ​​in the data window (true - display, false - hide).

  • ShowMedians - (True / false) parameter is valid only if the supplied ShowHistoricalIndicatorValuesOnChart parameter value false; at a value between the true values ​​and the pivot support and resistance levels median line drawn.

  • UseCustomStartTime - (True / false) should be aware that this property is valid at installation SetTimeFrame on the daily timeframe.

  • StartTime - enter the start time in the specified format, ie hh: mm; parameter value is valid only when a true UseCustomStartTime parameter.

  • ShowHistoricalIndicatorValuesOnChart - (YES / NO) for the parameter selection display of historical values ​​pivot on the graph. Set to NO to display pivots for the current session.

  • pcolor - choice of colors pivot.

  • scolor - choice of color support levels.

  • rcolor - selection of resistance levels of color.

  • medianscolor - color selection of median values.


NB. Note that the value set StartTime must comply with the discovery of any bar on the current chart. For example, you can not set StartTime 17:30, if the indicator is applied to the hourly chart in the absence of a bar, which opens at this time on this chart.


Mt5 Classic PivotPoints

Related posts


  • Ultimate Strength Meter Strong


    Ultimate Strength Meter Strong VS Weak The indicator was created by a former employee of the hedge fund, and it is specifically designed to measure the...


  • Dynamic RSI Pointer MT5


    Dynamic RSI Pointer MT5 Dynamic RSI Pointer designed Pointer Productions Pledge of effective work in the market - this is the best combination of...


  • TradeLeader Indicator


    TradeLeader Indicator Signal indicator, based on the volatility of the asset. It tracks the volume levels of volatility and market movements with the...


Next posts


Price of Brent crude oil fell

The price of Brent crude oil fell below $ 40

The price of Brent crude oil for the first time since mid-March has gone below the important psychological mark of $ 40 per barrel. The decline is largely due to the publication of statistics on the growth of US reserves storages.

By 13:39 GMT, futures for oil of this brand traded near the mark of $ 39.76 and the price of West Texas benchmark WTI fell to $ 39.02 per barrel.

Yesterday Brent crude oil traded in the range of $ 40,52-41,59 per barrel and could not overcome the resistance of $ 41.80.

"Intraday volatility intensified: on the day Brent barrel fell by more than 4%," - said in the review of Sberbank CIB.

Last week, the US oil reserves rose by 9.4 million barrels to a record 532.5 million barrels, according to the Energy Information Administration, which almost coincided with the published data of the day before the American Petroleum Institute. The main causes of growth stocks have become increasing imports and seasonal reduction processing volumes.

Pressure on oil quotations also had a strengthening of the US dollar the fifth consecutive session. Yesterday the representative of the US Fed Dzheyms Bullard, has the right to vote in the Federal Open Market Committee, suggested that the regulator may increase the rate of this year more than is now provided a scatter plot of the central bank (twice). Comment Bullard helped the US currency to strengthen at the same time put pressure on commodity markets.

"Today, interest in risky assets is not observed, and the market may test the strength of the 100-day moving average at $ 39.49 per barrel", - says Dmitry Kolomytsyn and Iskander Lutsk, analysts Sberbank CIB.

According to Denis Davydov from Nordea Bank, the level of $ 38-42 for Brent are still relevant.

The focus of the attention of traders will be data on the number of drilling rigs Baker Hughes. Volume and trading activity today reduced in anticipation of the holidays in the West - Good Friday and Catholic Easter.


Related posts


  • Ruble fell in anticipation of


    The ruble fell in anticipation of the Central Bank meeting and amid weak activity Exporters This afternoon, the Russian Ruble reduced trades the currency...


  • Price Action from Nyala Fuller


    Price Action from Nyala Fuller How to create your own trading plan I found that most traders do not have a trading plan, they do not know how him to do,...


  • Brent rises in price on statement


    Brent rises in price on the statement of Iran's readiness to discuss freezing oil Barrel Brent North Sea oil supply in October London auction August 31...


Next posts


Friday, September 23, 2016

Fx Easy Signals

Fx Easy Signals


Fx Easy Signals - easy-to-use universal trading tool that can work with any character on any timeframe. You can trade currencies, commodities, indices, metals, stocks, etc. Absolutely no limits!


For scalping, day trading, swing-trading, etc. You can also use the built-sensitivity filter, which is a good complement to trade the small time frames.


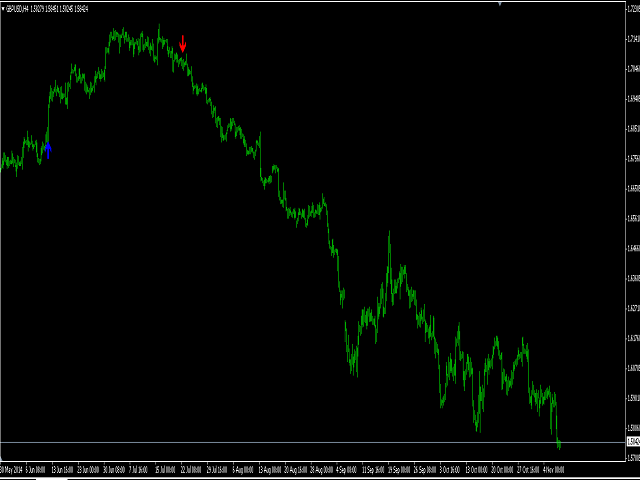
Use the indicator is very easy. Red arrow - Sell, blue arrow - buy. The indicator can be used alone or together with any other indicator. After the purchase I give unlimited support.


View the work of a real account here: https://www.mql5.com/ru/signals/64751


Fx Easy Signals

Related posts


  • AFX Easy Scalp


    AFX Easy Scalp AFX Easy Scalp - a simple and reliable indicator for scalping. It works on all timeframes, but is optimized for scalping on the M1. AFX...


  • Simple Trade


    Simple Trade technical indicator Simple Trade , developed by a group of traders for your convenience. The indicator is calculated on a fairly complex...


  • HelpLine


    HelpLine Introducing novelty in 2014 - nepererisovyvayuschiysya and easy to use HelpLine indicator for the Forex market . The indicator tracks trends,...


Next posts


Thursday, September 22, 2016

Traders expected devaluation of

Traders expected devaluation of the national currency of Saudi Arabia, may suffer losses due to rising oil prices

Forward contracts on exchange rate Saudi Riyal 12 months close to the minimum level since November. According to Bloomberg estimates, putting on these forwards of $ 1 million at the peak value in January, investors would have lost 68.9 thousand. Riyals ($ 18.37 thousand.), Or about 1.8%.

Thus, concludes Bloomberg, oil prices rebound to around $ 40 per barrel means that investors count on the refusal of Saudi Arabia from continuing for 30 years rial peg to the US dollar, may suffer losses

In February, the agency sources reported that the devaluation of the currency of Saudi Arabia, in particular, put a few US hedge funds.

Reducing rates for refusal Gulf states peg the national currency to the dollar reflects the resumption of oil prices growth this year. Oil is the main source of income of Saudi Arabia, can finish in positive territory for the second month in a row.

With the beginning of February, oil has risen in price by about 50%.

Since 1986, the exchange rate of the national currency is the Saudi rial 3.75 / $ 1.

"We have said that those who are preparing for the devaluation will be disappointed"- said the chief economist of HSBC Holdings (LON: HSBA) Plc in Central and Eastern Europe, the Middle East and North Africa in London, Saymon Uilyams.

According to him, the countries of the Persian Gulf "30 years retain peg to the dollar in times of high and low oil prices" and it does not seem to the recent decline in commodity quotations "changed their position or pushed for immediate action".


Related posts


  • GBPUSD at end of year is expected


    GBP / USD: at the end of the year is expected to increase demand for the dollar current dynamics at the last week British currency significantly...


  • Articles for traders


    Articles for traders Technical analysis indicator "Bollinger" Bollinger Bands (Bollinger bands) - technical analysis indicator indicating the current...


  • Free fall of ruble 69 5 euros


    Free fall of the ruble: 69.5 euros per dollar of 63.5 On Tuesday morning, the ruble It continues to weaken after uncertain behavior on Monday. Play...


Next posts


Wednesday, September 21, 2016

New forecasts from Nordea concerning

New forecasts from Nordea concerning Gbp

* Nordea Bank AB - a Swedish commercial bank, an international financial group, one of the largest in Northern Europe. The headquarters is based in Stockholm.

For EUR / GBP Bank analysts say that the couple should go down to 0.76-0.75 in the coming months.

But GBP / USD pair should recover and move towards 1.46-1.48.

The same analysts write that the price of oil reached its bottom, and should rise towards USD 50 per barrel.

Signals are copied, distributed, and to earn $ https://www.share4you.com/ru/?affid=0fd9105


Related posts


  • Oil and Putin two factors for


    Oil and Putin - two factors for the ruble Beginning of the week was interesting: the People's Bank of China surprised the market by cutting the rate of...


  • Overview of Russian stock market


    Overview of the Russian stock market and oil market Overview of the Russian stock market and the oil market. Russian stock market closed yesterday mixed....


  • Asia stock closed in red zone


    Asia stock closed in red zone after Chinese reports Today, 1 September stock index Asia-Pacific region again showed a reduction - after data on business...


Next posts


Tuesday, September 20, 2016

Breakout Scalping System

Breakout Scalping System


Counselor Breakout Scalping System is based on the breakthrough strategy.


Entering the market occurs when it detects a breakthrough.


You can use the default settings.


requirements


  • low spread

  • M5 period

  • 5-digit quotes


  • EURUSD, GBPUSD


Options


  • useMM: Use money management.

  • risk: Percentage of equity trading.

  • fixedLots: Lot size, if the money is being used.

  • spreadFilter: Maximum spread in pips.

  • magicnumber1: A unique number 1.

  • magicnumber2: A unique number 2.


Breakout Scalping System

Related posts


  • System 1


    System 1 Adviser strategy Classic breakout strategy with pending orders . Every 15 minutes, the order is reset. For issuing warrants used indicators TEMA...


  • Joker System Stable


    Joker System Stable The new version poluskalperskogo multicurrency Expert Advisor , which uses an advanced adaptive trading strategies based on the...


  • Recovery Pro


    Recovery Pro It is completely automated and adaptive advisor using restoration algorithm zone (Zone Recovery Algorithm) in strategic places. If you need...


Next posts


Monday, September 19, 2016

RealTrader

RealTrader


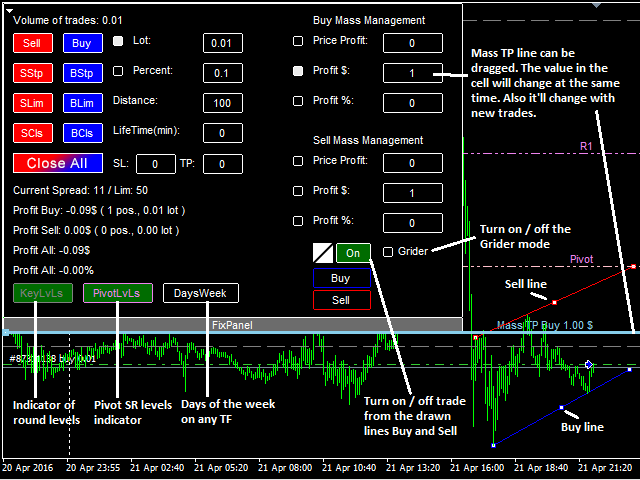
RealTrader - trade management tool for the elite and a great investment in your professionalism.


The panel was developed specifically for the management of public accounts and is intended for professional traders (which can easily be considered a huge potential and usefulness of this tool), or those who want to become quickly established.


It is well known: to learn how to trade the forex market, it is necessary first of all to sell. Nothing will ever replace your experience and trade with RealTrader bring you a lot of fun and will help to better understand the market.


With RealTrader panel you always have the right to make mistakes due to the convenient mass transaction management. You just need to drag and drop a line in the chart, and Take Profit of all transactions in the direction immediately set to the desired level, and you will know exactly what your profit potential at this level throughout the bulk of transactions. You can also in a special box on the chart set the desired profit in the deposit currency or as a percentage of the deposit and RealTrader immediately set the Take Profit at the right level for the mass of open trades in the direction of.


Draw arbitrary lines on the graph is an excellent technical analysis tools, and the ability to automatically trade on these lines makes RealTrader simply an indispensable tool in the trade. Analyze the market, select the type of transaction, draw a line of any length and any angle (build a canal or any figure of the selected lines Buy and Sell), and when the price touches the line, open the desired transaction necessary volume and with given your Take Profit and Stop Loss. When RealTrader will need to trawl your profits.


Skilled merchants often use levels pivot, support and resistance as well as so-called psychological (round) levels, so for maximum efficiency and user convenience in RealTrader built appropriate indicators, display which can enable or disable the buttons on the panel. There is also a convenient indicator of the separation of days of the week.


All main trading parameters are adjusted directly on the chart.


The simplicity, speed, and the clarity of trade management are the main advantages of this panel, so it is feasible and comfortable multi-currency trading.


Parameters, which are regulated in the chart


  • Lot - static lot size;

  • Percent - dynamic lot size, depends on the balance;

  • Distance - distance of pending orders;

  • LifeTime - lifetime of pending orders;

  • SL, TP - starting values ​​for single transactions;


The values ​​of mass Take Profit in both directions:


  • price Profit - the price at which TP is established for all transactions directions;

  • Profit $ - enter the desired amount of profit, and calculate RealTrader TP for all transactions directions;

  • Profit% - specify the required% profit, and calculate RealTrader TP for all transactions directions.


Input parameters


  • SpreadLimit - setting the maximum spread for opening transactions;

  • SlipNorm - Slip controller;

  • MagicNumber - transaction identifier;

  • orderstop (RealStops, VirtualStops) - real / virtual mass TP;

  • Length of Breakeven / Trailing (0-Off) - bezubytka length;

  • Breakeven - plus bezubytka;

  • Step of Trailing (0-Off) - Trailing Stop step.
  • Setup Grider Levels - setochnika setting. There are five levels
    accompanying pending orders, which can be configured as
    anything. With the active checkbox Grider on the panel, each transaction is open
    panel accompanied pending orders given here.
    Accompanying pending orders can be anything for anyone
    directions. Directions operate independently.


Since the panel is semi-automatic, testing is recommended only in the visualization mode. Drawing lines is not working in the tester.


I will be glad to consider the wishes of customers to improve the panel and make the agreed changes. Write to the PM.


RealTrader

Related posts


  • TradePadMini


    TradePadMini TradePadMini Panel simplifies the manual trading . This is a more economical version TradePad panel. It takes up less space on the screen,...


  • Dashboard Super Candle


    Dashboard Super Candle Dashboard Super Candle - It is intuitive and easy to use graphical tool that helps you: Monitor 28 couples one panel. Track...


  • FC Money Manager


    FC Money Manager This panel evaluates The volume of transactions and the ratio of risk reward ( Risk: Reward ) Based on said risk Interest ( Risk Percent...


Next posts


Friday, September 16, 2016

EURUSD waiting two important m

EUR / USD: waiting two important meetings

TRADING RECOMMENDATIONS

according to published
According to today, the trade balance in the euro area deteriorated in February for the year (20.2
billion euros against 21.2 billion in the previous month). Along with other
previously given macro data, this confirms the deterioration
economic and trade conditions and can add arguments in favor of further
QE program of expansion in the euro area.


CPI
prices in the Euro zone, released yesterday, showed in March, a zero annual growth.
Released earlier in the week on industrial production data were also
negative, worse than forecast in February and showed a gain of negative dynamics
(-0.8% vs. 0.7%). ECB's efforts to inflation and
support the euro area economy, remain ineffective, which could give
European Central Bank more determined additional expansion
the program of quantitative easing in the Eurozone. As repeatedly stated earlier
key representatives of the ECB's management, if the prospects deteriorate,
"reduction in interest rates will be one of the possible options". at
This even mentioned the famous statement of the former head of the Federal Reserve Bernanke
"dumping money from a helicopter".


Considering
next weekend the important events (meeting of G20 and meeting
representatives of the largest oil-producing shit in Doha), the EUR / USD could to
Monday to remain in a narrow corridor between the levels 1.1285, 1.1240. However, due to the unpredictability
results of the meeting and the decisions taken, it is recommended towards the end of the trading day to close
trading positions.

EURUSD waiting two important m


Related posts


  • Larri Vilyams Training important


    Larri Vilyams: Training - important in trading and running Trader and marathon runner Larri Vilyams (Larry Williams) It draws parallels between...


  • EURUSD Euro continues to lose


    EUR / USD: Euro continues to lose ground against the dollar During the Asian trading on Tuesday morning, the euro against the the dollar continued its...


  • Russia increases gold reserves


    Russia increases gold reserves at record pace At that time, while the prices Gold in global markets as a whole November decline, Russia's central bank It...


Next posts


Thursday, September 15, 2016

Spread

Spread


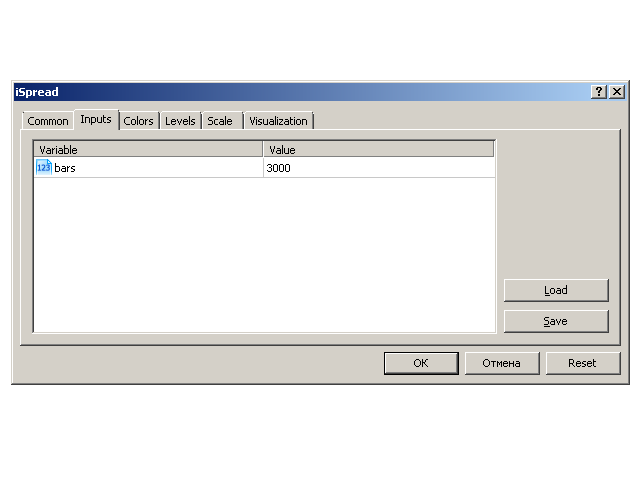
The usual spread indicator. It reflects the spread on each bar. It must be remembered that displays the spread at the time of the opening of the bar. Therefore, the most correct information will be in the minute bars. Who are interested can use the indicator.


Spread

Related posts


  • Bollinger Bands on Bars


    Bollinger Bands on Bars The script exports the file OHLC prices of each bar on the current graphics and numerical values ​​of Bollinger Bands (BB)...


  • RSI on Realtime Deals


    RSI on Realtime Deals At the time of the transaction script records the value of the indicator Relative Strength Index (RSI) and OHLC price bars. For...


  • RSI on History Deals


    RSI on History Deals From the report of transactions is not possible to get the value of the indicator Relative Strength Index (RSI) and OHLC prices...


Next posts


Wednesday, September 14, 2016

Standard Poor's downgraded credit

Standard Poor&# 39; s downgraded the credit ratings of China

The outlook on the Standard Poor's agency of China adjusted the credit rating of the experts from "stable" to "negative." In a statement the agency said that the long-term rating was affirmed at AA- level.

The Standard Poor's explain its decision to the growth of economic and financial risks of creditworthiness Chinese authorities.

The document notes that the GDP of the state will continue to rise by an average of 6% or more every year until 2019.


Related posts


  • Sell ​​GBPAUD Credit Suisse


    Sell ​​GBP / AUD - Credit Suisse Traders should consider selling the GBP / AUD this week, according to Credit Suisse in his weekly message to customers....


  • Big Three Wall Street recovers


    Big Three Wall Street recovers losses trading session Wednesday ended on Wall Street steady growth . DJIA added 1.33%; 500 S P makes the fastest growth...


  • Dollar has appreciated at time


    The dollar has appreciated at the time , although the reports did not coincide with the predictions employers was added 173 thousand. jobs in August (the...


Next posts


Tuesday, September 13, 2016

Saudi Arabia has reduced oil exports

Saudi Arabia has reduced oil exports in February to 7.553 million barrels per day

ABU DHABI (Reuters) - Saudi Arabia in February reduced oil exports to 7.553 million bpd from 7.835 million in January, according to official statistics.

In the reporting month, the country of oil extraction decreased to 10.220 million barrels per day with 10.230 million in January, according to the Joint Oil Data Initiative to (JODI) - the organization that collects data on the world oil market.

Monthly data on exports provided JODI Riyadh and other members of the Organization of Petroleum Exporting Countries (OPEC) and published on the website of the organization.

According to JODI, the oil reserves in Saudi Arabia fell to 305.599 million barrels in February to 314.119 million barrels the previous month.

Oil refining in the country's refineries in February totaled 2.67 million barrels per day compared to 2,468 in January, while exports of waste petroleum products rose to 1.55 million barrels to 1.343 million.

Oil consumption for power generation in February decreased to 291.000 barrels per day from the previous month 293.000.


Related posts


  • In Saudi Arabia unexpected reshuffle


    In Saudi Arabia - an unexpected reshuffle , but the oil still falls Yesterday all of a sudden the king of Saudi Arabia, Salman withdrew from his younger...


  • Saudi Arabia freeze oil production


    Saudi Arabia freeze oil production only in conjunction with other manufacturers DUBAI (Reuters) - Saudi Arabia will fix the oil level only if so will the...


  • Price of Brent crude oil fell


    The price of Brent crude oil fell below $ 40 The price of Brent crude oil for the first time since mid-March has gone below the important psychological...


Next posts


Auto ZZ SR Indicator

Auto ZZ SR Indicator


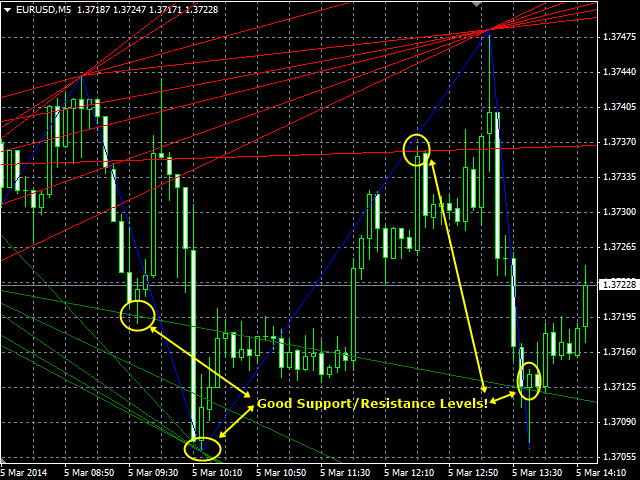
This indicator automatically draws the trend lines on the upper and lower points of extremum using the ZigZag indicator. As an indicator of the market movement is constantly updating the line on the graph. It can work on any type of account or chart. All parameters can be adjusted.


settings:


  • Delete_Lines - When set to true indicator will delete old trendlines as the formation of new extremum points indicator ZZ. If false, the old trend line will be deleted.

  • Num_ZZ_Extremes - Number of past extreme points indicator ZZ, used in the construction of trend lines.

  • SupportColor - Color trend line support.

  • ResistanceColor - Color trend line resistance.

  • ExtDepth, ExtDeviation, ExtBackstep - are the basic parameters of the ZigZag indicator.


Note: ZigZag indicator can also be displayed on the graph. For this you just need to specify the color value in the "Color".
Auto ZZ SR Indicator

Related posts


  • ToWave Indicator


    ToWave Indicator Indicator ToWave builds "waves", and fractals extrema using the configuration of the surrounding of spark HL-levels. Using the built...


  • Indicator Combine Merge by Runwis


    Indicator Combine Merge by RunwiseFX It allows you to combine multiple indicators in one both visually and in alerts. These can be standard indicators...


  • Buy Sell Indicator


    Buy Sell Indicator LED indicates the moments when you need to buy (blue arrow) or sell (orange arrow). It has two input parameters: barsNumber - the...


Next posts


Monday, September 12, 2016

Quadro Multi Grid Scalper

Quadro Multi Grid Scalper


We never know what the market price will do in the next second. That is why it is important to the trader a good exit strategy.


Quadro Multi Grid Scalper - high grid scalper using RSI and price action, with three groups of grid-orders, working independently.


Advisor can work with my other expert "Sure Fire Hedging Strategy". 


This EA uses for averaging the output of the system security settings martingale, and also uses the hidden levels of stop-loss and take-profit to protect against slipping.


It is protected on the basis of the delay for the automatic delay of orders in the highly-volatile markets, preventing an excessive amount of orders in the grid.


By default, the adviser works with the aim of daily profit of 1% of the starting balance. This means that the expert tries to achieve stably daily goal of 1% (20% per month).


Recommended options broker:


  •  Low spread, less than 1 point (from brokers with low spreads have quick opening and closing).

  •  Low-level stop.

  •  A small step in 0.01.


Recommended timeframes for adviser: M1 or M5.


You must use a good money management system. Money management will help to protect your funds.


Councilor parameters:


  • in_1 - setting money management.

  • First_Balance - enter your initial deposit in this parameter before starting the advisor.

  • MM - automatic lot size for the first order.

  • Risk - risk option for automatic lot size.

  • in_2 - daily goal percentage.

  • Target - to use or not setting a daily goal.

  • Daily_Target - default profit goal of 1% per day.

  • in_3 - parameter indicator.

  • RSI - use / no indicator RSI for the first order.

  • Candle_Breakout - use / no action prices for the first order.

  • in_4 - the parameters of the RSI indicator.

  • PeriodRSI - RSI period.

  • in_5 - options breakdown candle.

  • PeriodCandleBreakout - price period.

  • in_7 - grid parameters A.

  • Disable_Grid_A - set to true to turn off the grid A at the opening of the first order.

  • MaxTrades_Grid_A - the maximum number of open orders in the grid A.

  • PipStep_A - distance in the grid, the default of 50 points (5 pips).

  • First_Lots_A - first order lot size for the parameter value MM = False.

  • LotExponent_A - customizable lot multiplier.

  • First_TakeProfit_A - takeprofit first order, default is 25 points (2.5 pip).

  • MagicNumber_A - the magic number of orders grid A.

  • in_8 - grid settings B.

  • Disable_Grid_B - set to true to turn off the grid B at the opening of the first order.

  • MaxTrades_Grid_B - the maximum number of open orders in the grid B.

  • PipStep_B - distance in the grid, the default of 50 points (5 pips).

  • First_Lots_B - first order lot size for the parameter value MM = False.

  • LotExponent_B - customizable lot multiplier.

  • First_TakeProfit_B - takeprofit first order, default is 25 points (2.5 pip).

  • MagicNumber_B - the magic number of grid orders B.

  • in_9 - grid parameters C.

  • Disable_Grid_C - set to true for C mesh off at the opening of the first order.

  • MaxTrades_Grid_C - the maximum number of open orders on the grid C.

  • PipStep_C - distance in the grid, the default of 50 points (5 pips).

  • First_Lots_C - first order lot size for the parameter value MM = False.

  • LotExponent_C - customizable lot multiplier.

  • First_TakeProfit_C - takeprofit first order, default is 25 points (2.5 pip).

  • MagicNumber_C - the magic number of orders grid C.

  • in_10 - grid settings D.

  • Disable_Grid_D - set to true for the D off the grid at the opening of the first order.

  • MaxTrades_Grid_D - the maximum number of open orders in the network D.

  • PipStep_D - distance in the grid, the default of 50 points (5 pips).

  • First_Lots_D - first order lot size for the parameter value MM = False.

  • LotExponent_D - customizable lot multiplier.

  • First_TakeProfit_D - takeprofit first order, default is 25 points (2.5 pip).

  • MagicNumber_D - the magic number of grid orders D.

  • in_1234 - protection deferred.

  • Delay_Mode - Using the postponement of orders, true or false (Use default value).

  • Delay_Individual - deferral for individual nets, true or false (Use default value).

  • Delay_ALL - deferral for all grids, true or false (Use default value).

  • in_20 - manual forced closure, the emergency exit.

  • Note_in_20a - FC_1 < Equity = closing of all transactions, advisor update.

  • FC_1 = 1000000.

  • Note_in_20b - FC_2 < Equity = closing of all transactions, advisor stop.

  • FC_2 = 1000000.


Quadro Multi Grid Scalper

Related posts


  • Executive Multi


    Executive Multi Executive Multi - fully automatic Advisor working on EURUSD and GBPUSD Without adjustment of test results. Testing was performed on data...


  • EA Hard war Bears and Bulls


    EA Hard war Bears and Bulls Advisor trades using indicators Hard scalper and War Bears and Bulls. Trend indicator is calculated War Bears and Bulls, and...


  • Quantum Scalper


    Quantum Scalper Quantum Scalper - Advisor to the original algorithm trade breakdown price levels. It allows the use of a small stop loss, so risks and...


Next posts


Thursday, September 8, 2016

Speculators increasing their short

Speculators increasing their short positions in Brent

After rising by more than 50% in the period from February to March, the oil is rapidly becoming cheaper. June futures for Brent crude oil approaching the lows of early March. By 14.30 Moscow time the oil barrel of Brent crude cost $ 37.56 and WTI crude oil traded at $ 35.62 a barrel.

The market participants are skeptical about the forthcoming meeting in the Qatari capital on 17 April. Recall that at the end of last week, Saudi Arabia said that the freeze production levels only in the event that Iran will go to similar measures. Iran, meanwhile, plans to increase production to 4 million barrels a day. This jeopardizes the possibility of concluding any agreement was on 17 April.

«Brent quotes are gone in a lower range of $ 37,50-38,40 per barrel with $ 38,00-42,80 per barrel recorded in March, when market participants expected a positive outcome of the upcoming summit in Doha. According to the Intercontinental Exchange in long speculative positions on the Brent crude oil, the rate of increasing the volume of long positions has slowed down, and we are seeing a slight increase in short positions in Brent », - writes Dmitry Kolomytsyn and Iskander Lutsk, analysts Sberbank CIB.

"Against the rising oil prices play a potential to increase the supply of oil on the market, - says Denis Asainov, Criminal Analyst« Alpha Capital ". - It can contribute to the return of Iran and Libya on the market, as well as the adaptation of the American mining companies to the new realities of the market by reducing the cost. In addition, companies are able to quickly increase production through the development of drilled but not designed well. "

According to Bloomberg, Libya, refused to participate in the April summit, in March increased the export of oil to its highest level in three months.

Today, the market is also waiting for the release of data on stocks of raw materials in US stores by the American Petroleum Institute. Analysts expect to see the eighth consecutive week of growth.


Related posts


  • Brent wins back losses deal on


    Brent wins back losses: deal on Iran seems to be delayed crude oil Brent back up from the three-month low. By 14.29 MSK August futures is $ 57.30; WTI...


  • Price of Brent crude oil fell


    The price of Brent crude oil fell below $ 40 The price of Brent crude oil for the first time since mid-March has gone below the important psychological...


  • In Saudi Arabia unexpected reshuffle


    In Saudi Arabia - an unexpected reshuffle , but the oil still falls Yesterday all of a sudden the king of Saudi Arabia, Salman withdrew from his younger...


Next posts


FiBoPivot

FiBoPivot


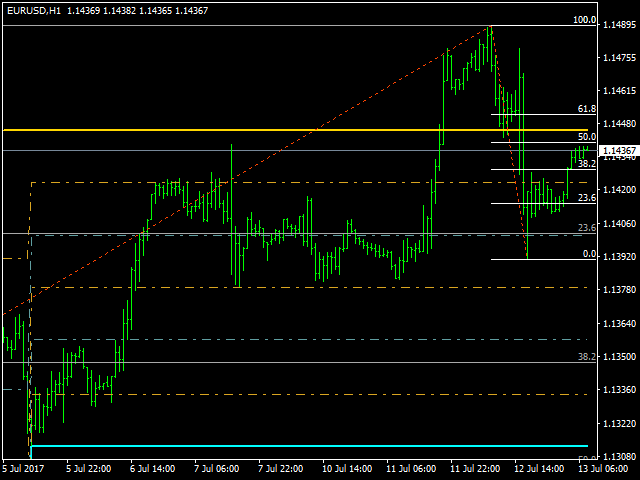
This indicator support / resistance levels, rather than buy / sell. If there is reliable evidence of price action (for example, derived indicators Holy Trinity
Prices, Peaker or any other), and to determine the most likely direction of prices, the indicator displays the support / resistance levels at which the price of the pre-correction during retrace.


As shown by the historical data, the indicator shows the timely correction of the point, so the value of the indicator must be selected carefully.


  • Father Period - the number of bars from which starts the calculation of the maximum price (for bullish trend) or minimum (for bearish).
  • Son Period - the number of bars in the interval. Used in conjunction with
    Father Period for determining the maximum and minimum range.
  • Holy Spirit - percentage or fractional value is multiplied price difference of maximum and minimum values ​​within the set of the first two parameters. It allows you to fix the price levels, which displays the Fibonacci levels.

FiBoPivot

Related posts


  • Veles SuperTrend


    veles SuperTrend The indicator is based on the MA with additional study of all current prices, as well as all the highs and lows for the period. Good...


  • RightDirection


    RightDirection Indicator RightDirection great tool and assistant to work with the trend. He performed well when paired with other indicators that signal...


  • Levels of Volatility


    The Levels of Volatility The indicator indicates support / resistance levels based on the volatility of the currency for a selected period (the number of...


Next posts


Wednesday, September 7, 2016

Plan B4

Plan B4


The Plan B4 expert's work is based on the analysis of price movements (Price Action). Closing a position occurs when
the appearance of the opposite signal.


Input parameters


  • Period - the number of bars used for analysis;

  • Mode - Expert mode (0-11);

  • Fixed Lot - Lot fixed value;

  • Variable Lot - AC Lot as a percentage of free margin.


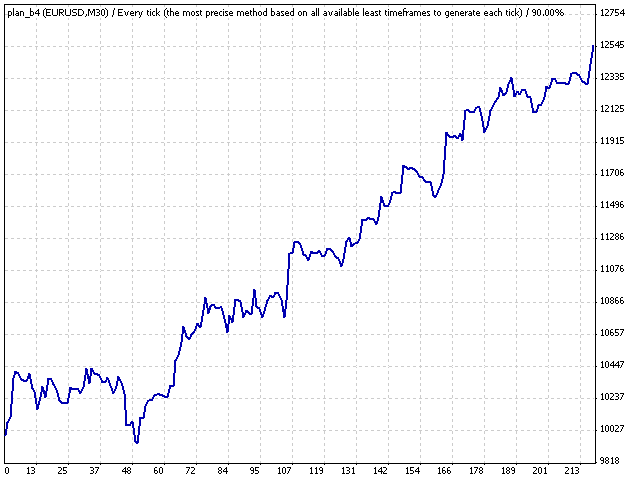
The screenshots shows the results of backtesting.
Testing was conducted with EURUSD and timeframe in M30
mode, the "Every tick" for the period from 01.07.2013 on 02.08.2014. used
fixed lot 0.1 Period value equal to 11, the expert mode 10, 20 spread.


Plan B4

Related posts


  • TimeTrader


    TimeTrader TimeTrader Irresistible as time. Advisor is the result of many months of hard work in trying to create a system that does not need a big...


  • Aero Swing


    Aero Swing This EA is based on the detection of the trend with four moving averages, RSI indicator, MACD indicator and the indicator WPR. The order is...


  • FastBreak


    FastBreak The robot trades on the break of support and resistance levels on the selected timeframe. It works effectively in many symbols and timeframes...


Next posts


Tuesday, September 6, 2016

ECB promises to keep incentives

ECB promises to keep incentives

The European Central Bank (ECB) at the end of the July meeting to leave interest rates on loans at zero and did not change the QE program parameters. The regulator also kept interest rates on deposits at the level of minus 0.4% per annum, and the rate on the marginal lending to 0.25% per annum. Controller solutions in line with the expectations of most analysts.


Related posts


  • Dollar strengthened kiwi and Aussie


    The dollar strengthened , kiwi and the Aussie rose On Thursday, the dollar He wins back the lost positions on Thursday. By 11.20 MSK EURUSD dropped to...


  • Basis points


    Basis points (basis point). The definition of the basic points can have several meanings, depending on the application, and a recording method. Basis...


  • Negative interest rates mean that


    Negative interest rates mean that the Bank of Japan is the currency war - Kuroda TOKYO (Reuters) - The Central Bank is not engaged in a currency war,...


Next posts


Monday, September 5, 2016

Analyst from company ForexMart

Analyst from the company ForexMart (ForeksMart)

13.07. fundamental analysis

The focus today:

  • The index of producer prices in the US

  • Speech by US Federal Reserve Chairman Janet Yellen

Yesterday, the US dollar lost positions before the performance Janet Yellen and finally weakened after. Investors were disappointed in the US currency due to insufficient optimistic position Yellen. Fed chief said that future policy depends on inflation, which at the moment is below the target level. Overall Yellen rejects plans for further rate hikes, but does not insist on them.

The Canadian dollar is updated yearly highs against the US dollar after the Bank of Canada took the expected decision to raise rates by 25 bp. n., and updated forecasts of GDP growth for the next 1.5 years. regulator representatives said that the slowdown in inflation is a temporary phenomenon, and the chairman Tsentrobanka Stiven Poloz has no doubt that the policy of monetary tightening over time will continue.

Australian and New Zealand dollars are also stronger because of rising commodity prices and the US dollar's decline. As commodity currencies were supported at the expense of a good trade and economic statistics from China.

Euro unexpectedly weakened against the US dollar after a speech Dzhanet Yellen, while all other major currencies strengthened. Most likely, this is due to fall in profitability of European bonds and technical factors. Next week will be a meeting of the ECB and, possibly, investors fear that the officials refuse to "hawkish" position.

Pound sterling was also up against the US dollar, supported by good data on the labor market.

Technical analysis of the levels of Pivot 13.07.

EUR / USD
Yesterday the pair designated maximum level near 1.15, then gone down to the level of 1.14. Today in the morning was an attempt to develop an upward movement, but it was unsuccessful and the couple is now located a little above the level of 1.14, below the level of Pivot 1,14292. Indicators signal a decrease in pair. If the pair is able to demonstrate growth in the region R1 1,1469, it can test the level of 1.15. If not - we expect decrease in pair in the region S1 1,1371. Support levels: 1.13717, 1.13319, 1.12744. Resistance Levels: 1.14690, 1.15265, 1.15663

GBP / USD
Yesterday marked the pound at least 28 June, but recovered quickly and started climbing to 1.29. Today, the pound showed a growth in the region last week's highs. The pair is currently trading near the R1 1,2927. Indicators point to the growth of the pair. Today, the pair is possible in the region of 1.30. Support levels: 1.28326, 1.27745, 1.27376. Resistance Levels: 1.29276, 1.29645, 1.30226

USD / JPY
After rising on Tuesday, the yen sharply yesterday tore down to lows of 6 July, and today continued to decline, designating at least in the region of 112.856. RSI is close to oversold levels and now turned up. MACD tends downward. Penetration level S1 112,749 indicate a further reduction pair. Support levels: 112.7490, 112.3180, 111.7150. Resistance Levels: 113.7830, 114.3860, 114.8170

USD / CHF
Yesterday the pair broke through the upper boundary of the descending channel and has designated week high of 0.96949, and before that Frank had gone to week lows. Today steam touched S1 0,96157, and then pushed and starts an upward movement. Now the franc is trading at 0.9655, testing the upper limit of the downward range. Today we expect the growth to two-week highs. Support levels: 0.96157, 0.95794, 0.95569. Resistance Levels: 0.96745, 0.96970, 0.97333


Related posts


  • Daily Economic Digest from Forex


    Daily Economic Digest from Forex.ee Daily Digest of economic Forex . ee Keep an eye on major economic news with us Wednesday, August 30 Couple EUR / USD...


  • GBPUSD at end of year is expected


    GBP / USD: at the end of the year is expected to increase demand for the dollar current dynamics at the last week British currency significantly...


  • Forex ee Economic Daily Digest


    Forex.ee: Economic Daily Digest Daily Digest of economic Forex . ee Keep an eye on major economic news with us Wednesday, May 25 EUR / USD He moved away...


Next posts


Friday, September 2, 2016

Global shares rise on oil prices

Global shares rise on oil prices stabilize

In Europe and Australia, the share prices of mining companies is rapidly moved up on a background of recovery in commodity prices after steep declines.

On Tuesday, global equities rose after oil prices stabilize, and the Dow Jones Industrial Average closed above 18,000 for the first time since July. Stoxx Europe 600 rose 1% in morning trade, following a recovery during the Asian trading session.

Mining stocks rose in Europe and Australia, as commodity prices continued to recover after a sharp decline on Monday.

Brent crude oil increased by 2.1%, reaching a level of $ 43.82 per barrel, higher than the price established to unsuccessful negotiations to freeze production at the weekend. Analysts said that oil prices were supported on Tuesday due to strike oil in Kuwait, reducing fears on global glut in the market.

Futures pointed to a slight increase in the opening of the S P 500. However, changes in futures do not always reflect the behavior of the market after the opening of the trading signal.

Previously, growth stocks of energy and mining sectors led the Australian index S P / ASX 200 to a three-month high.

On Monday, Japanese equities have slowed down the rapid decline after the yen stabilized against the US dollar and concerns about the financial impact of the recent earthquake in Japan. Japan's stock index Nikkei closed 3.7% higher.

The dollar has fallen nearly 10% against the yen this year, putting pressure on Japanese exporters and forcing the head of the Bank of Japan Haruhiko Kuroda to hint at the possibility of further stimulus measures in a recent interview with Wall Street Journal.

In other currencies, the euro was up 0.3% against the dollar at $ 1.1241 as investors waited for the study of German economic sentiment in the euro zone and study loans.

Investors also continued to focus on corporate earnings. Shares of Danone SA began the slow growth after the French dairy producer reported a drop in sales in the first quarter, which corresponded to analysts.

Shares of Roche Holding AG also rose slightly after a Swiss pharmaceutical company won analysts' forecasts for the first quarter earnings.

In the US on Monday, International Business Machines Corp. reported a decrease of 4.6% in the first quarter revenue and profits decline by 13.5%. The shares fell after-hours trading.

Goldman Sachs Group Inc., is scheduled to report its first quarter results before the opening of Wall Street. Analysts expect quarterly earnings $ 2.45 per share, which is more than 2 times lower than the $ 5.94 per share in the same period a year ago.

While the income of the largest US banks was above expectations last week, "It should be considered in its true light, changes in the downward income for the year", - Dzhim Rid said, strategist at Deutsche Bank.


Related posts


  • Shares of ATP on Thursday turned


    Shares of ATP on Thursday turned to growth after the Chinese rebound Today markets The Asia-Pacific region mainly grown. Chinese stock market found...


  • Oil futures continued to rise


    Oil futures continued to rise. Brent 15-week high By 10:00 MSK November Brent futures are $ 52.72 per barrel for WTI - $ 49.59. The main reason Gain...


  • US stocks rose on Monday


    US stocks rose on Monday, stock US stocks rose on Monday, the expectation that the Fed will be forced to offset concerns about surprisingly weak report...


Next posts


Thursday, September 1, 2016

GBP

GBP


The graph bars (HLC) of GBP in a separate window with the long-term and short-term regression channel for easy identification of currency strength or weakness.


  1. For GBPUSD: Direction of movement of the pair is easy to see when the product is used in conjunction with indicators US Dollar and VSA volume.

  2. For EURGBP: Direction of movement of the pair is easy to see when the product is used in conjunction with indicators EURO and VSA volume .

  3. For GBPJPY: Direction of movement of the pair is easy to see when the product is used in conjunction with indicators JPY and VSA volume.

  4. For GBPCHF: Direction of movement of the pair is easy to see when the product is used in conjunction with indicators CHF and VSA volume.

  5. For GBPAUD: Direction of movement of the pair is easy to see when the product is used in conjunction with indicators AUD and VSA volume.

  6. For GBPNZD: Direction of movement of the pair is easy to see when the product is used in conjunction with indicators NZD and VSA volume.

  7. For GBPCAD: Direction of movement of the pair is easy to see when the product is used in conjunction with indicators CAD and VSA volume.


GBP

Related posts


  • MarketMeter


    MarketMeter It is easy to use for multiple timeframe indicator cluster analysis of these currencies. It provides a simple but at the same time effective...


  • Multicurrency Cross Oscillator


    Multicurrency Cross Oscillator Description Color universal indicator / oscillator crossing moving averages. It is possible to raise or lower coloring...


  • Momentum Filter Histo


    Momentum Filter Histo Momentum Filter Histogram or Chinkou Filter Histogram - histogram of the filter impulse or Chinkou This indicator Momentum more...


Next posts


Batman

Batman Batman Advisor is based on a very simple system that uses ZigZag indicator and breakdown strategy. Transactions are opened only whe...