Thursday, May 31, 2018

Poseidon Scalper

poseidon Scalper


Advisor uses a scalper strategy, slowly and carefully selecting the entry point.


Advisor is designed to work on EURUSD M5.


A small number of settings makes poseidon Scalper accessible to understanding, even for inexperienced traders.


Options


  • EAMagic - magic number adviser;

  • EAMagic2 - second magic number adviser. Also used "domestic" magic numbers: 48556,48557,48558,48559,48560;

  • TimeToClose - the time in seconds, after which the transaction is considered to be hopeless and closed;

  • Risk - part of the deposit in the percentage used to automatically calculate the lot;

  • AutoLot - It can be set to "true" and "false". When set to "true" advisor chooses to trade lot size depending on the balance;

  • Lots - lot size set by the user, if the value AutoLot equal to "false";

  • SpreadLevel - the maximum size of a spread, in which EA will trade;

  • DD - the maximum allowable drawdown;

  • TerminalGMTshift - shift your broker terminal time with respect to GMT time;

  • SummerAdjustment - correction for daylight saving time (only used for testing, for more accurate results). In real trade must be "0".


Recommended settings - by default, but you can experiment with optimization for your broker. Especially TimeToClose parameter.


Recommended broker - either 5-digits EURUSD with a spread of less than 20.


To work correctly, a counselor in your terminal history H1 timeframe needs to be loaded.

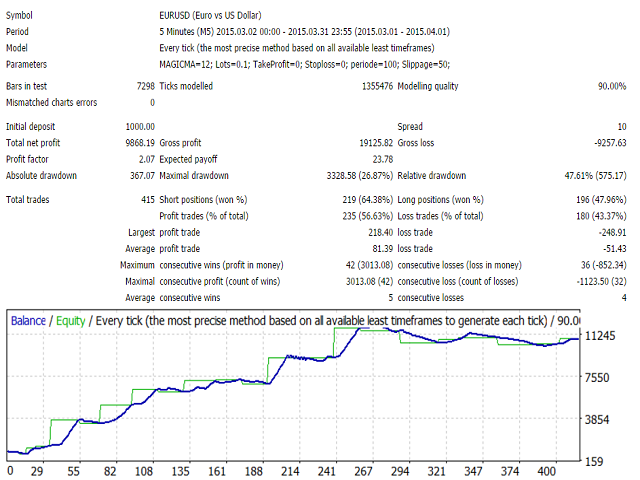
Below - screenshots testing with different levels of parameter Risk.
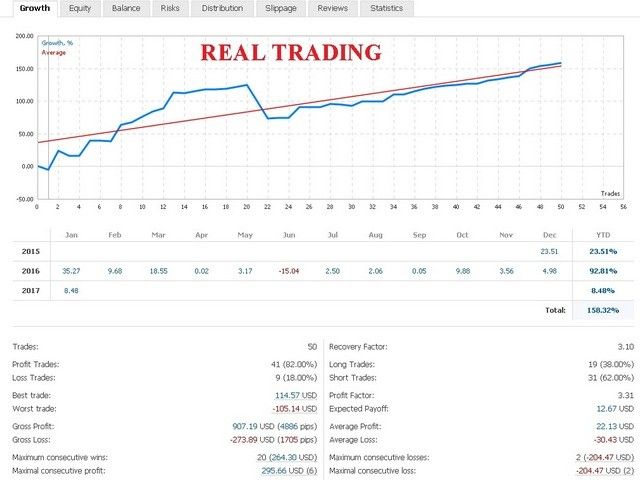

Poseidon Scalper

Related posts


  • CAP Asian Scalper EA


    CAP Asian Scalper EA CAP Asian Scalper - Advisor is using a range breakout strategy to enter a quiet market . EA trades scalping for small deviations of...


  • Quantum Scalper


    Quantum Scalper Quantum Scalper - Advisor to the original algorithm trade breakdown price levels. It allows the use of a small stop loss, so risks and...


  • Quadro Multi Grid Scalper


    Quadro Multi Grid Scalper We never know what the market price will do in the next second. That is why it is important to the trader a good exit strategy....


Next posts


  • RoboTradeSoft Neuronet

  • Moving Average Cross

  • Zeus

JP Morgan sees end of rally in

JP Morgan sees the end of the rally in the yen

USD / JPY is increasingly gaining momentum (currently - Y108.66), checking the growth potential, and the participants, and market analysts are wondering about the prospects for the pair. "We expect that the ability to go far beyond the Y110 is low in the short term"- JP Morgan analysts say in the report, adding that the JPY is approaching a very weak levels in real terms. JPY, in terms of the effective exchange rate - weighted average exchange rate against the currencies of Japan's trading partners, fell to 65.7 as of Tuesday. She dropped to 64.8 on average in December 2013 - the lowest since the moment when JP Morgan started keeping records in 1970. Shinji Kureda, head of FX-treydingooy group at Sumitomo Mitsui Banking, says he does not expect that the pair will rise too much, adding that, probably, USD / JPY reached Y112 by the end of the year. Source: Forexpf.Ru - Forex Market News


Related posts


  • EUR updated for at least 14 months


    EUR updated for at least 14 months: Germany eased euro zone The euro on Wednesday fell below $ 1.28 for the first time 14 months and continued to decline...


  • PBOC maintains normal movement


    PBOC maintains the normal movement of the renminbi Chinese regulator strengthened its "verbal" support the yuan and says it will intervene if the market...


  • Dollar has appreciated at time


    The dollar has appreciated at the time , although the reports did not coincide with the predictions employers was added 173 thousand. jobs in August (the...


Next posts


  • On Wednesday in Europe grew everything

  • Comments Societe Generale for

  • Dollaryen Citigroup warned

Wednesday, May 30, 2018

Silver collapsed on forecasts

Silver collapsed on forecasts by the Fed and China

On Monday afternoon,
futures silver fallen up to the
price from July 2010, as
growing expectations of growth of credit
rates in the US and fears that China is not
will promote economic
promotion, putting pressure on
quotes.


On the Comex division
silver for delivery in December fell ??
to a session low of $ 17.33 per troy
ounce, the lowest level since July 28
2010. During European morning
Bid prices recovered to the last
bargain at $ 17.60, down 24.1 cents,
or 1.35%.


The price on Friday ??
silver lost 67.3 cents, or 3.63%, to
$ 17.84. Futures are likely to find
support at $ 17.18, the low of June 7, 2010
year low and resistance at $ 18.59, the high of
September 19th.


Also on the Comex gold from
delivery in December fell to ??
a session low of $ 1208.90 per troy
ounce, the weakest point since January 2,
before trading at $ 1214.60, down $ 2.00, or
0.16%.


Copper delivery
?? December fell by 5.0 cents, or
1.61% to trading at $ 3.042 per pound, minimum
from June 15.


Related posts


  • Silver or stagnation over


    Silver or stagnation over monthly graph March finished in silver in a symbolic plus (+ 0.37% to 16.6615) and "April" this week went to a minus. The...


  • US stock markets closed mixed


    US stock markets closed mixed , Dow Jones added 0.40% The US stock market closed the trading session on Monday in different directions due to the...


  • New forecasts from Nordea concerning


    New forecasts from Nordea concerning Gbp * Nordea Bank AB - a Swedish commercial bank , an international financial group, one of the largest in Northern...


Next posts


  • JP Morgan sees end of rally in

  • On Wednesday in Europe grew everything

  • Comments Societe Generale for

Tuesday, May 29, 2018

Daily Breakouts

Daily Breakouts


Important: To correct the menu font should download and install the font Agency FB!


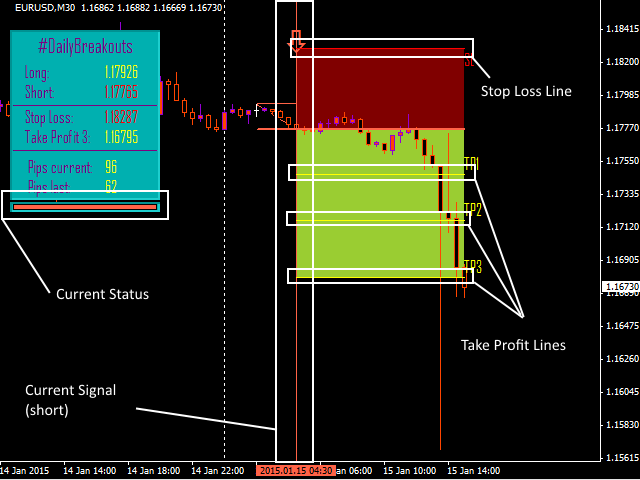
DailyBreakouts - the perfect tool for traders using breakthrough strategy!


at first DailyBreakouts analyzes last day, then - the beginning of a new day. Thereafter breakthrough indicator signal outputs.


Built-in menu allows you to efficiently keep track of pips, breaking zone, stop-loss and take-profit.


The indicator works on the M30 and H1. During the work it produces a signal in the day, so use it on other timeframes does not make sense.


To increase the efficiency it is recommended to use the product in combination with Trendindicator (TrendfollowerSR). This lets you receive double confirmation before entering the market.


Advantages of application together with TrendFollowerSR


  • two trendlines

  • built-in oscillator

  • built-in zone SR for trend

  • tracking other timeframes using the menu

  • tracking pips with trend

  • Very easy to learn and apply


Features DailyBreakouts


  • The overall picture of the market (à la carte)

  • Display of stop-loss and take-profit on chart

  • Very easy to use

  • Suitable for both experienced and novice traders

  • Increased efficiency in combination with trendindicator

  • is not redrawn


Input parameters


  • Digits Broker - the number of digits in the price on the chart


signals:


  • Draw Vertcal Lines - display vertical input line

  • Show Timestamp - display time input line

  • Buy-Line Color - color vertical line to buy

  • Sell-Line Color - color vertical line for sale

  • MT4 Alert - enable alerts in MetaTrader 4

  • EMail Alert - include alerts via e-mail

  • Mobile Alert - include alerts on a mobile device


Stop Loss and Take Profit:


  • Risk type - high risk -> take-profit and stop-loss is placed further away from the point of entry

  • Stop Loss Color - color line stop loss

  • Take Profit 1 Color - the color of the first line of the take-profit

  • Take Profit 2 Color - the color of the second line of the take-profit

  • Take Profit 3 Color - the color of the third line of the take-profit

  • Draw Background - show / hide the stop band loss and take profit

  • Stop Loss Background Color - a background color area stoploss

  • Take Profit Background Color - background color take-profit zones


Menu:


  • Show Menu - show / hide the menu

  • Coord. X - X coordinate of the menu (horizontal)

  • Coord. Y - Y coordinate of the menu (vertical)

  • Menu Background color - color menu


  • Menu Label color - font color

  • Menu in Background - show other objects through the menu

  • Statuscolor BUY - color line status menu to BUY (bottom)

  • Statuscolor SELL - color line status menu to SELL (bottom)


Daily Breakouts

Video


Related posts


  • Fibonacci Swing Scalp


    Fibonacci Swing Scalp Fibonacci Swing Scalp (Fibonacci-SS) The indicator automatically sets Fibonacci line on the highs and lows of the visible part of...


  • Indicator Combine Merge by Runwis


    Indicator Combine Merge by RunwiseFX It allows you to combine multiple indicators in one both visually and in alerts. These can be standard indicators...


  • Monthly Pivots With Time Shift


    Monthly Pivots With Time Shift And Alerts introduction Monthly pivots indicator calculates and displays the monthly pivot levels on MT4 charts. The...


Next posts


  • CurrencyRSI

  • Trend Navigator

  • VolumePlus

Monday, May 28, 2018

Rubber tape

Rubber tape


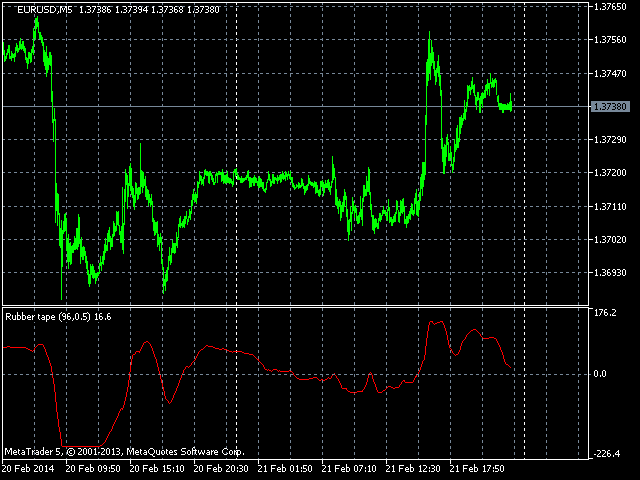
Rubber tape indicator combines trend following indicators and oscillators.


The calculation uses the values ​​of the indicator moving average. indicator values ​​are calculated in pips.


The indicator has two input parameters:


  • Period - the number of bars for the calculation;

  • Tension - "tension coefficient" in the interval [0,1].


Rubber tape

Related posts


  • Extended Keltner Channel MT5


    Extended Keltner Channel MT5 Extended version of the Keltner Channel. You can use a variety of moving average 21 and 11 different prices to calculate the...


  • TSO Currency Trend Aggregator MT5


    TSO Currency Trend Aggregator MT5 Indicator TSO Currency Trend Aggregator job compares the behavior of currency pairs 7. It allows you to instantly...


  • Moving Average Price Level


    Moving Average Price Level Moving Average displaying price tags. settings Period MA - MA period; Shift MA - displacement of MA; Method MA - smoothing...


Next posts


  • Levels MQL MT5

  • Synthetic

  • JARSI

Friday, May 25, 2018

CloseAllSymbol

CloseAllSymbol


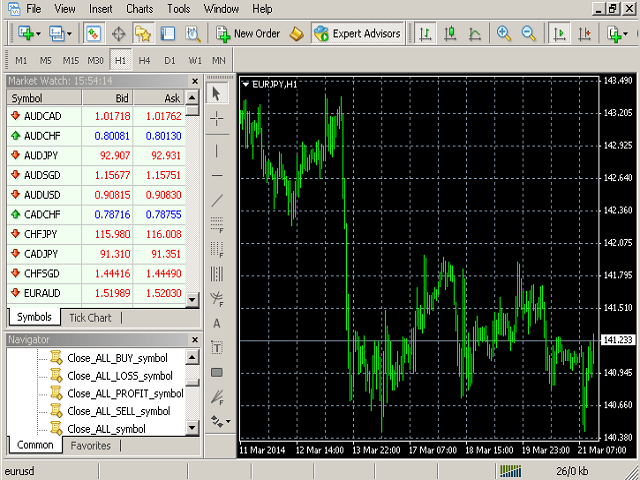
Closing all the character of orders, which is cast on the chart.


Before running the script, allow auto trade.


CloseAllSymbol

Related posts


  • History orders Visual


    History orders Visual Useful and interesting little script for trading in Forex. Used to display the history of orders and trading history of one...


  • Copy Trader MT4


    Copy Trader MT4 Copy Trader - a convenient and fast copier orders for MetaTrader4. Advisor performs copying orders of terminal - server to one or more...


  • RealTrader


    RealTrader RealTrader - trade management tool for the elite and a great investment in your professionalism. The panel was developed specifically for the...


Next posts


  • Symbols Manager demo

  • Trade Report Pro Demo

  • FxConnect Basic Slave Free vers

Thursday, May 24, 2018

Hedging Martingale EA

Hedging Martingale EA


Hedging Martingale EA - automatic system.


Advisor uses technical analysis to determine the trend and follow it. The robot uses hedging when changing trend and waiting for a new trend, and using the martingale grid.


Advisor is simple to use and works on all cylinders.


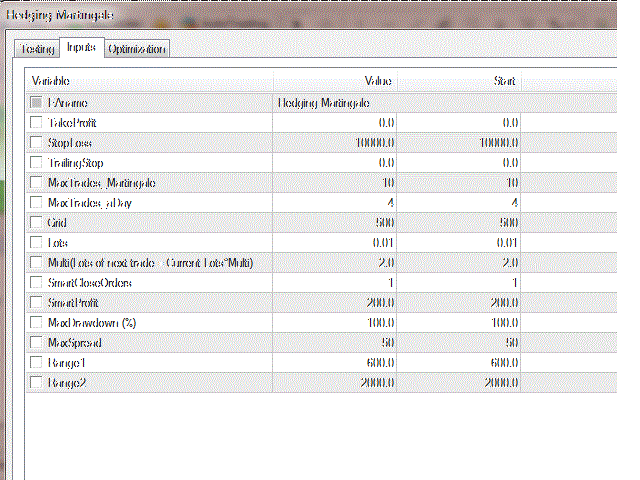
Options


  • EA name - the name of the adviser: Heging Martingale (can be changed)
  • TakeProfit / StopLoss - take-profit / stop loss points
  • TrailingStop - trailing stop; is active, if the profit (in points) = TrailingStop + Grid
  • MaxTrades_Martingale - the maximum number of transactions, depending on the balance and your preference for risk
  • MaxTrades_aDay - the maximum number of trades per day
  • Grid - the distance between the two transactions (in points)
  • Lots - the initial auction
  • Multi - lots next trade = Lots x Multi
  • SmartCloseOrders - order number from which the activated SmartProfit
  • SmartProfit - if the profit = SmartProfit, all transactions are closed
  • Drawdown - if the loss = Drawdown x balance, all transactions are closed
  • MaxSpread - if the spread > MaxSpread, the transaction is not committed
  • Range1 (in points) - If the price moves within range1, the transaction is not committed
  • Range2 (in points) - If the price moves outside Range1, but within range2, deals are made. If the price is predelemi Range2, the transaction can not be opened.

You can change the settings TrailingStop, Multi, SmartCloseOrders,
SmartProfit, Grid, Drawdown, Range1, Range2 to produce different results.


Good luck!


Hedging Martingale EA

Related posts


  • Universal Partial Close


    Universal Partial Close The eternal question: "How to keep the earned profit?" you can use partial closure (Partial Close - PC). PC do better...


  • Statistic Trader


    statistic Trader Expert statistic Trader - this trading strategies, based on two ideas: the idea of ​​probability occurrence of an event and the idea of...


  • FastBreak


    FastBreak The robot trades on the break of support and resistance levels on the selected timeframe. It works effectively in many symbols and timeframes...


Next posts


  • Poseidon Scalper

  • RoboTradeSoft Neuronet

  • Moving Average Cross

Wednesday, May 23, 2018

UBS advice on intra day trading

UBS: advice on intra-day trading in FX

EUR / USD: we do not like to trade against the trend, but it seems that the pair is approaching the time of correction. Buy at current levels with the stop below $ 1.2800 and the goal of at least $ 1.2950;

USD / JPY: the pair so far failed to gain a foothold above Y109.00, but good demand and not allow it to fall below Y108.50. The week began with a profit, the apparent deterioration in risk appetite and a decrease in yield of US bonds. Therefore sell pair at current levels to Y108.20 / 30, where it is possible to turn based on the regrowth. Stop in this case should be placed below Y107.50;

GBP / USD: the pair of sharp growth, provoked by the announcement of the results of the Scottish referendum, followed by at least a sharp decline. Now, the British currency is consolidating, trying to determine the direction of further movement. We recommend buying the pound / dollar at current levels and averages on dips. Stop should be placed below the $ 1.6300;

AUD / USD: the early hours of Monday the couple spent consolidating around Friday's closing levels, but closer to the beginning of the European session downtrend has resumed amid falling quotations of iron ore and global stock indices. We recommend to sell on rise to $ 0.8950 with a stop above $ 0.9020.

Source: Forexpf.Ru - Forex Market News


Related posts


  • Trading house


    Trading house. Trading house. Usually, we present trader to work on exchange platform or a huge office among dozens or even hundreds of colleagues,...


  • Profitable trading system


    Profitable trading system Glad all welcome to my blog! I decided to write a short article about system trading, because explore different approaches to...


  • Gold Trading Forex


    Gold Trading Forex. In spite of their belonging to the precious metals gold is also the subject of intense speculation in the forex market . gold on the...


Next posts


  • Silver collapsed on forecasts

  • JP Morgan sees end of rally in

  • On Wednesday in Europe grew everything

Tuesday, May 22, 2018

EUR updated for at least 14 months

EUR updated for at least 14 months: Germany eased euro zone

The euro on Wednesday fell below $ 1.28 for the first time 14
months and continued to decline on Thursday on the back of strong data from the
US, weak reports from Germany and head of the European applications
Central Bank, Mario Draghi, reports Bloomberg.

Euro in the course of trading on September 25 was worth $ 1.2767 compared with $ 1.2780 at the close of the previous session.


"Our
forecast for the euro is absolutely "bearish". Previously, you could at least
select Germany as the torch of the eurozone, but now it is not so"-
said Dzhennifer Veyl of OBank Wealth Management.

According to
Draghi, exchange rates currently reflect the differences in monetary
Eurozone policy and other countries and regions of the world. The index of business
confidence in Germany, which is calculated IFO, fell in September to
the lowest level since April 2013, worse than market expectations. According to the data
National Association of Realtors, sales of new homes in the US in August
jumped 18% compared with the previous month and reached a maximum
May 2008 - 504 thousand homes at an annual rate.. analysts
average expected increase of only 4.4%.


Related posts


  • Dollar has appreciated at time


    The dollar has appreciated at the time , although the reports did not coincide with the predictions employers was added 173 thousand. jobs in August (the...


  • Hotels in Turkey fall in value


    Hotels in Turkey fall in value against the background of a weak flow of tourists Last month, the occupancy rate of hotels in Turkey was once again at the...


  • USDJPY on positive NFP retained


    USD / JPY: on the positive NFP retained. What's next? Technical analysis and trading recommendations - HERE! Despite a slight decrease from the beginning...


Next posts


  • UBS advice on intra day trading

  • Silver collapsed on forecasts

  • JP Morgan sees end of rally in

Virtual Level of Market Prices

Virtual Level of Market Prices


The indicator is based on a new theory of the market, advanced, reasonable and discussed in a branch of the same name on the forum https://www.mql5.com/ru/forum/58256


New market theory is based on the principles of receiving or not receiving profits. It is equally aptly describes as a real market for goods and services, and the Forex market. If the real market it allows to identify the conditions for obtaining the maximum profit, then the Forex market, the same theory, without any change of concepts and levels, allowing to enter the break-even trading conditions, and in practice it is confirmed.


According to this theory, the market prices are four levels.


Along with the current price of C (Bulls or Bears), we observe on the terminal actually exist virtual market price P (bears or bulls) that are closely related to the current price of D and by the will of the optimal Tsopt (Leo) and average market Rp (Leopard ) prices are mutually transformed into each other, so to speak.


The indicator allows you to see the beginning of the formation of trends, moments of transition into a flat and vice versa - in the trend of the specific behavior of the virtual level of market prices.


Work on these principles indicator clearly visible in the above video. In fact, the market candle periodically disappear and are formed again due to a complete recalculation of the indicator, for example, when upload historical data terminal.


The indicator allows you to see the true battles and current market levels prices, reaching into the depths of the market, which until now were invisible to researchers markets and traders. I hope that the use of the indicator allows traders to conduct successful trading in any time frames, especially on the M1.


Good luck to all trade with the indicator, which is an X-ray, highlights the state of the market.


Options


  • Calculation period - calculation period;

  • The width of the Bull Candle body - body width bullish candle;

  • Colour of the Bull Candle body - the color of the Bull Candle body;

  • Colour of shadovs bullish candle - color shadows bullish candle;

  • The width of the Bear Candle body - body width bearish candle;

  • Colour of the Bear Candle body - body color bearish candle;

  • Colour of shadovs bearish candle - shadow color of bearish candles.


Virtual Level of Market Prices

Video


Related posts


  • Level Moving Averages Message


    Level Moving Averages Message Indicator Level Moving Averages Message (see the description, video) does not paint a very moving average line in the chart...


  • DreamCatcher


    DreamCatcher The indicator shows a favorable entry points into the market by the arrows. Can be used for pipsing on small periods, and for the long-term...


  • NewBbandsMT4


    NewBbandsMT4 Probably every trader known indicator Bollinger Bands (Bollinger Bands). This indicator is similar to moving average envelopes, but based on...


Next posts


  • Daily Breakouts

  • CurrencyRSI

  • Trend Navigator

Friday, May 18, 2018

Grail Finishing stometrovka

Grail: Finishing stometrovka.

Finishing stometrovka. The most difficult meters.

Now working to improve the reliability, the ideal machine to be unsinkable under any circumstances.

Burrs on the chart is the mark of intensive work subsidence monitoring functions.

The necessary algorithms found (essno all redone again almost from scratch), but left to set up,

those. profitnye raise 3-4 times with the same parameters of subsidence.

Configuration is quite time-consuming - a lot different to the need to build. And most of them are interrelated.
What is the most important thing - it should be set-up and not fit the original story.
Check the settings are the vilest parts of history, repeatedly shifting with the test launch date.

But this is small, just a job.


As of right now the work of the owl looks like this (the euro since 1 September 2013 to 19 September 2014):

Grail Finishing stometrovka

Those who said "predSpasibo":
First of all, I apologize for the disorientation of Photo - hoping to catch, it did not work.
The excuse: I do not want for real "Thank you" give imperfection. So Wait, plz, even a little.


Related posts


  • High frequency trading interview


    High frequency trading - an interview with Haim Bodek Haim Bodek - an extraordinary figure for the financial world. After receiving a bachelor's degree...


  • How long will capital twice


    How long will the capital twice? If you have saved the money and want extra income, investing is a better option. But if you do not know what to invest...


  • How to choose PAMM account and


    How to choose the PAMM account and control. The Internet is one of the most profitable ways to invest their own money, one of the possibilities earn,...


Next posts


  • EUR updated for at least 14 months

  • UBS advice on intra day trading

  • Silver collapsed on forecasts

EURUSD under pressure in anticipation

EUR / USD: under pressure in anticipation of the ECB

Analysts at Danske Bank to evaluate the development scenario of EUR / USD on the eve of the ECB meeting.


Key points:

"Tomorrow's meeting of the ECB will set the tone for trading on the Euro-pairs for the 2nd half. It seems that the ECB is still too early to give up the option downside risks, as described above in the introductory statement, the regulator is described as a risk "substantially balanced" because it can lead to unnecessary tightening of financial conditions.

According to a Bloomberg poll, analysts' opinions with respect to tomorrow's meeting divided. There is an assumption that if the ECB does not will to make changes in its communications policy, EUR / USD punch 1.12 south. Most likely, instead, the controller simply will correct other parts of the opening statement in a more hawkish direction. "

The terminal number 1 in the world to operate in the financial markets.


Related posts


  • Ruble fell in anticipation of


    The ruble fell in anticipation of the Central Bank meeting and amid weak activity Exporters This afternoon, the Russian Ruble reduced trades the currency...


  • EURUSD waiting two important m


    EUR / USD: waiting two important meetings TRADING RECOMMENDATIONS according to published According to today, the trade balance in the euro area...


  • EURUSD Euro continues to lose


    EUR / USD: Euro continues to lose ground against the dollar During the Asian trading on Tuesday morning, the euro against the the dollar continued its...


Next posts


  • Grail Finishing stometrovka

  • EUR updated for at least 14 months

  • UBS advice on intra day trading

Wednesday, May 16, 2018

Screencast Maks Kayzer Who and

Screencast: Maks Kayzer. Who and what inflates bubbles in the market?

In the new edition of "Review of Kaiser Max" Maks Kayzer and leading
Steysi Herbert discuss what is a reliable criterion for evaluating the state of the economy. They are also trying to find answers to the questions: What are based reporters, predicting potential crises? Can the
Federal Reserve to keep the market from falling? View this video will be useful and interesting for any trader and a person who is interested in these issues.

guest program
Mitch Fayerstayn, fund manager and author of the book "Planet Ponzi"
He will talk about his trip to Italy, on stress testing, as well as
rules of the game in the banking sector.


Video:


Related posts


  • Video Maks Kayzer Markets no longer


    Video: Maks Kayzer. Markets no longer give fruits and America waits IV round of quantitative easing In the next issue program "Review by Max Kaiser...


  • Video Maks Kayzer Last Days of


    Video: Maks Kayzer. The Last Days of the American Empire This major release saying that the US empire is crumbling - exactly the same as many centuries...


  • Screencast Maks Kayzer Kriptoserebro


    Screencast: Maks Kayzer. Kriptoserebro , crowdfunding and freking boom In this video tutorial Maks Kayzer and his guests talk about how interlinked the...


Next posts


  • EURUSD under pressure in anticipation

  • Grail Finishing stometrovka

  • EUR updated for at least 14 months

Tick ​​Volume Histogram Indicator

Tick ​​Volume Histogram Indicator


Indicator Tick Volume Histogram is drawn in a separate graphic window.


It displays the number of ticks on the histogram peak, drawn in a separate window.


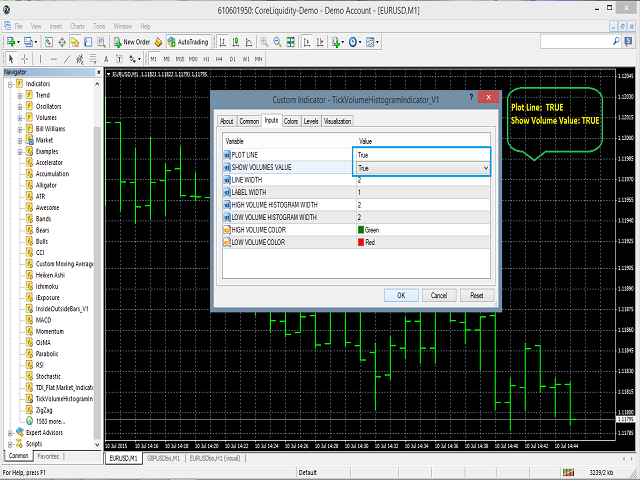
Equipped with a bar graph display feature a variety of ways:


  1. If Plot Line and Show Volume are false, the bar with lots of ticks displayed as large histogram, and a bar with fewer ticks displayed as a smaller bar graph.

  2. If Plot Line is set to true, and the Show Volume is false, the line is drawn, which unites the peaks of the histogram.

  3. If Plot Line and Show Volume are true, then together with the connecting line of the peaks of the histogram shows the number of ticks on the histogram peak.


Indicator Tick Volume Histogram enables you to customize the color and width of the histogram.


It also allows you to adjust the width of the number of ticks to be displayed on the histogram peak.


Tick ​​Volume Histogram Indicator

Related posts


  • Auto ZZ SR Indicator


    Auto ZZ SR Indicator This indicator automatically draws the trend lines on the upper and lower points of extremum using the ZigZag indicator . As an...


  • Harmonic Trading Pro Indicator


    Harmonic Trading Pro Indicator Harmonic Trading Pro Indicator is unlike any other one harmonic light in the market . This harmonic light has a very...


  • Bollinger Histogram


    Bollinger Histogram Histogram of the difference of the upper and lower level lines Bollinger. Height Histogram range extension means for trending portion...


Next posts


  • Virtual Level of Market Prices

  • Daily Breakouts

  • CurrencyRSI

Tuesday, May 15, 2018

Will dollar as strong in IV quart

Will the dollar as strong in the IV quarter?

scramble
for dollars and the sharpest increase
volatility of currencies in recent years
were the main features of the financial
markets in the third quarter. concluding
months of the year with a high probability
will be no less "bouncy".


What happened?


7 percent
The dollar was the biggest jump
quarterly rise in US
currency, since the same period
2008, when the collapse of Lehman Brothers triggered
the collapse of the global house of cards
economy, and during the crisis in the dollar
not invested just lazy. Such
large fluctuations in the reserve currency, in
which traded almost everything in the world,
since Apple's shares and
finishing on zinc futures - of course
also had an impact on all financial
markets. Especially felt this currency
emerging market and some
category.


For example,
larger than all of the 22 assets and
market instruments, tracked
Reuters, Chinese rose
A-Shares (that shares traded only
RMB on the Shanghai and Shenchzhenskoy
Exchange), which added 16%. Leaders to reduce
- Oil futures Brent, who
for the quarter it has lost almost 14%.
More than half of the considered 22
positions showed a decline.

In the euro area, where the increased threat
deflation, the ECB loosened its currency and
eased monetary policy to
historic levels. Towards
Euro dollar is now an all-time high. By
Compared with the yen, "green" is also updated
multi-year highs. Throw
Recent dancing with a tambourine, which
demonstrated around the Scottish currency
referendum - we can see that serious
fever and pound. variability courses
the world's major currencies in the third
quarter, as a result, was unprecedented.
Short-term fluctuations (particularly
As for the pound) beat all average
records.

What will happen?


The main thing from
which will depend fourth trends
quarter - the question of how
Investors will keep a collective
the belief that the US economy
He will continue to outperform their peers
and that the Federal Reserve will soon raise interest
bet. If this belief is enough
strong and the market will not prevail
pessimism - Dollar
It will increase further.


Director of
Global Strategic Development
Morgan Stanley, Hans
Redekert, commented: "High
volatility will feature
the next few months, because the dollar
It continues to grow. The financial world is not
It consists of isolated from each other
parts - in the environment is out of sync
the exchange rate is automatically
in the center of attention - because he
performs a kind of damping
role between different currencies, transfers
the momentum going. "

Emerging markets will cease to grow?


Strong
dollar and growing volatility - bad
omen for developing
markets, because investors are
becoming less risk averse. They
They prefer to place their funds
the relatively safe and therefore
more attractive developed markets
- such as the United States. Accordingly, the flow
Investments in emerging markets will
continue to fall steadily, as well as
and valyuty.Bolshinstvo
emerging market currencies have suffered
in the III quarter. For example,
Brazilian real reached a six-year
low on Monday, his fall
It was about 10% during the quarter.
The last months of the year, most likely,
It will be characterized by exactly the
the same movements.

Jamie McGeever, Reuters columnist. Adapted translation - Aleksandr_Baht.


Related posts


  • Euro falls dollar strengthens


    Euro falls , dollar strengthens Yesterday, after the the collapse in oil prices, the euro crossed the a nine-year low, and now the EURUSD It is trading...


  • Midday and new currencies dollar


    Midday and new currencies: the dollar for 78 rubles , 97 rubles per euro.. Perhaps today the most hectic day on the foreign exchange market . News sites...


  • Dollar dropped to US data on applications


    The dollar dropped to US data on applications for benefits On Thursday, the dollar weakened against other major currencies after data showed that the...


Next posts


  • Screencast Maks Kayzer Who and

  • EURUSD under pressure in anticipation

  • Grail Finishing stometrovka

Monday, May 14, 2018

CAP Asian Scalper EA

CAP Asian Scalper EA


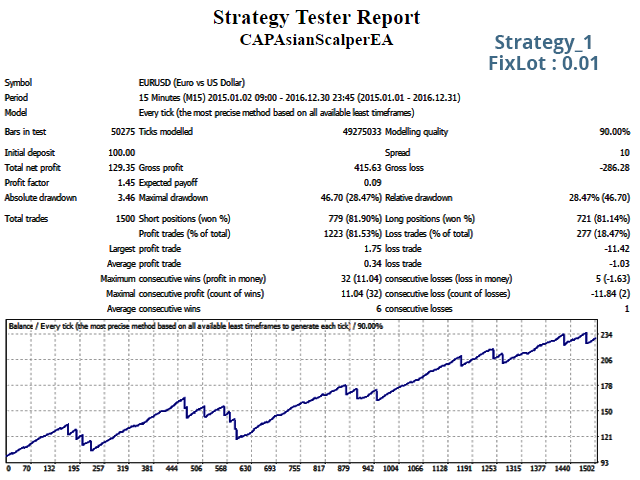
CAP Asian Scalper- Advisor is using a range breakout strategy to enter a quiet market. EA trades scalping for small deviations of the price. For successful operation requires a broker with small spread. Fully optimized for the EURUSD M15. It can also be used on other pairs like USDCAD, EURGBP, USDCHF. It trades on the basis of performance of several indicators, is not a scalper. Necessary leverage of 1: 300 or more, and the broker with a low spread. It is recommended to work with a broker with low spreads and VPS. You can start using it to $ 100.


Main advantages


  • It does not martingale.

  • Always use stop-loss orders to protect assets.

  • Easy-to-use.

  • Optimized for all currency pairs (recommended low spread).

  • It does not use hedging.

  • Low drawdown.

  • It works with different brokers.


Business requirements


  • A good broker.

  • Good internet connection.

  • Resistance.

  • The minimum leverage of 1: 300.


Testing on historical data


The expert uses tick data. Test Advisor on historical data on EURUSD with M15 timeframe in the "Every tick", choose the best options.


Advisor CAP Asian Scalper M15 is designed for graphics, but it can be optimized for any pair and timeframe. Try the demo version now!


Input parameters


EA CONFIGURATIONS - Configuration advisor


  • ActiveStrategy: choice of a trading strategy.

  • DailyMaxTrade: the maximum number of transactions per day. 0 - disabled.

  • MaximumSpreads: maximum spread at which allowed the opening of the transaction. If spread exceeds this value, the transaction will not be opened. Please note that the indicated spread in pips.

  • ECNBroker - install true using ECN-accounts, in other cases - False. It can be set to a value True on all types of accounts.

  • EmailAlert - email-notification when you open a new trade.

  • PushAlert - notification on your mobile device when you open a new trade.

  • Slippage - allowable slip when opening transaction (Pips).


STRATEGY_1 SETTING - setting strategy 1


  • MagicNumber: the magic number for the Strategy 1.

  • Fix Lots: fixed lot size for trading.

  • Risk Percentage: Automatic calculation of the lot on the basis of this option, if Fix Lots == 0.


STRATEGY_2 SETTING - Strategy Settings 2


  • MagicNumber: magic number for strategy 2.

  • Fix Lots: fixed lot size for trading.

  • Risk Percentage: Automatic calculation of the lot on the basis of this option, if Fix Lots == 0.


TIME CONFIGURATIONS - Setting time


  • AutoGMT: when True, automatically determine the mode of GMT (not for the tester!).

  • Manual GMT offset: Manual definition of GMT.


REMEMBER: This EA is intended only for the Asian market, so it is important to specify the correct time zone in the broker 'Manual GMT Offset' parameter.


Author


Capilta Business Solutions


CAP Asian Scalper EA

Related posts


  • Quadro Multi Grid Scalper


    Quadro Multi Grid Scalper We never know what the market price will do in the next second. That is why it is important to the trader a good exit strategy....


  • Quantum Scalper


    Quantum Scalper Quantum Scalper - Advisor to the original algorithm trade breakdown price levels. It allows the use of a small stop loss, so risks and...


  • NewsSpeed


    NewsSpeed News Speed ​​Advisor written for EURUSD M1 trading on news output, changing the settings can be probyvat other currency pairs and time periods...


Next posts


  • Hedging Martingale EA

  • Poseidon Scalper

  • RoboTradeSoft Neuronet

Friday, May 11, 2018

Screencast Maks Kayzer Kriptoserebro

Screencast: Maks Kayzer. Kriptoserebro, crowdfunding and freking boom

In this video tutorial Maks Kayzer and his guests talk about how interlinked the unpaid bills for water and unsecured
Detroit debt. Kriptoserebro = cryptocurrency and silver, as it would be dangerous for the banks? And what a shock it may cause cryptocurrency MaxCoin?

So many questions that lead looking for answers! Why are an increasing number of earthquakes in Oklahoma? Is the hydraulic reservoir is
economically unprofitable method of gas production? Maks Kayzer and Steysi Herbert
The answers to these questions, as well as explain why the share - profitable. In
the second part of a guest Tina Rothery talk about the companies,
extracting shale gas, and those who lead them fight.


Video:


Related posts


  • Video Maks Kayzer Disaster in


    Video: Maks Kayzer. Disaster in Chicago is unavoidable? Fresh release "Survey Max Keizer "rather unusual presenters and guests sit on the street, on the...


  • Video Maks Kayzer Last Days of


    Video: Maks Kayzer. The Last Days of the American Empire This major release saying that the US empire is crumbling - exactly the same as many centuries...


  • Video Maks Kayzer Markets no longer


    Video: Maks Kayzer. Markets no longer give fruits and America waits IV round of quantitative easing In the next issue program "Review by Max Kaiser...


Next posts


  • Will dollar as strong in IV quart

  • Screencast Maks Kayzer Who and

  • EURUSD under pressure in anticipation

Thursday, May 10, 2018

Advanced Trend Scanner

Advanced Trend Scanner


Advanced Trend Scanner identifies major trends and their reversals by using the blue and red lines and white arrows.


Our tools can not fit your trading style, so we strongly recommend that you start getting to know them a demo version for MT4. Please test indicator before buying.


Product reviews are welcome. We hope that the light will be useful to you.


Features


Advanced Trend Scanner identifies the main trends at the same time filtering out the short-term setbacks and false signals.


It uses the moving average, and smoothing techniques for obtaining reliable signals of topping. It works on any pair and timeframe.


  • Flexible tool, it can be used in many ways to improve the trading system

  • Email sending function to obtain information about the price level, the currency pair and time

  • Function display pop-up window to get information about the price level, the currency pair and time


trading rules


  • the input signals: will depend on your trading system


    • Operating purchases setting


      • White reversal Up Arrow

      • The blue line

      • optional: price broke below the cloud in Ichimoku indicator


    • Working sales setting


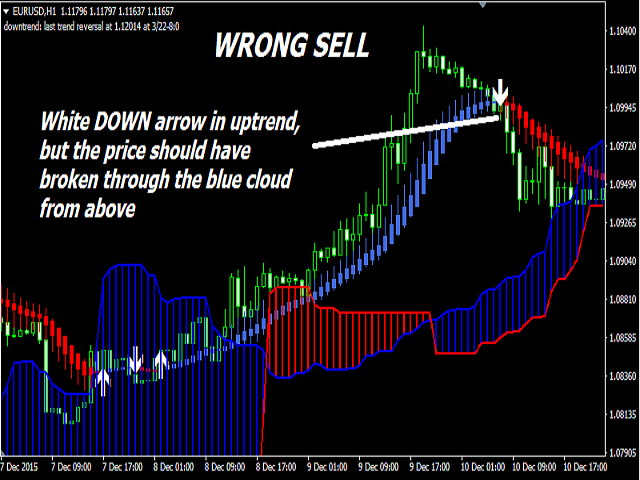
      • White reversal down arrow

      • Red line

      • optional: Price broke through the cloud on top of the indicator Ichimoku


  • exit strategy


    • The output will depend on your trading system


      • support / resistance zone

      • Signaling a turn arrow

      • Trailing Stops


Multitaymfreym


  • Day and swing trading: M15, M30, H1, D1, W1 or for round the clock


  • auxiliary tool


    • It combines well with other trending tools, such as the Ichimoku

    • Increase the probability of trading with the trend by using the Advanced Trend Filter

    • Avoid false signals by combining with Advanced Trend Filter


other features


  • Never redrawn

  • Not late with rendering

  • Never converted

  • Sending a signal to a strictly "bar closing"

  • It can be used to develop expert


Advanced Trend Scanner

Related posts


  • Trend Scanner


    Trend Scanner Indicator trend lines Trend Scanner It shows the direction of the trend and its change. The indicator works on all currency pairs on...


  • Trend Beads


    Trend Beads Trend Beads indicator does not contain a trend indicators, such as moving average or Bollinger. The indicator only works with the movements...


  • Pinbar Scanner With Trend Filter


    Pinbar Scanner With Trend Filter The indicator was created by the former employee of the hedge fund. It automatically determines the most probable pin...


Next posts


  • Tick ​​Volume Histogram Indicator

  • Virtual Level of Market Prices

  • Daily Breakouts

Tuesday, May 8, 2018

Technical Support our site to

Technical Support our site to the next level with the help of licensed software TEAMVIEWER

Technical Support our site to


Technical Support our site to the next level with the help of licensed software TEAMVIEWER

From the time of creation of the site, the main rule was that we provide around the clock support for our products and answer all your questions. Unfortunately, the concept of "clock support" one programmer is not compatible. But we try to answer all of your questions at any time.

We have previously used TeamViewer to Help Desk of our products, but now we have moved to a new level.

Having polnouyu license Teamviewer, we can provide the support without limits, in a convenient interface.

Teamviewer - is the most modern and safe program for remote access to your computer. All connections between our site and your desktop pass through multiple encryption.

You can be sure that using Teamviewer, we will solve your problem as soon as possible.

QuickSupport - Technical support via Teamviewer Teamviewer without installing the software.

You leave us a request for Help Desk. We process the request and connects to you to address the issues.

First of all, you can send us all the reports on their own:

  • Log files for detailed consideration of the problems with the robots MT4
  • Log files for detailed consideration of the problems with the robots MT5

Instructions for use Teamviewer QuickSupport

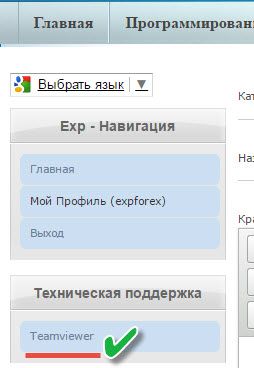
On our site, in the upper left section you can download the QuickSupport

Technical Support our site to


Technical Support our site to


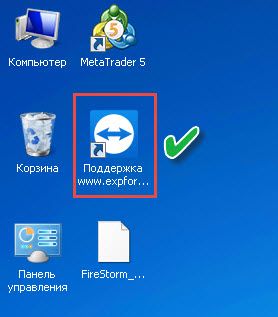
After starting QuickSupport on your desktop icon appears

Support www.expforex.com

Technical Support our site to


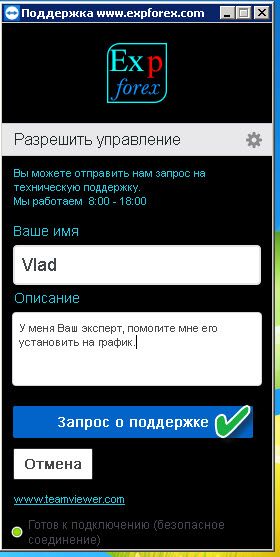
In the window that opens, you can enter your name and write a detailed description of the problem.

I recommend: Prepare your desktop for the adoption of Help Desk. Start the terminal, where you find a problem.

Then click Support request

Technical Support our site to


expect connection

Technical Support our site to


Your request for support will be given to us, and in no time we will be able to connect to you.

When you connect, you will have a box asking for permission to connect.

Technical Support our site to


You can use the chat to provide more detailed information about your problem:

Technical Support our site to


We wish you, that you have no problems. But the promise that when there are problems, we will provide technical support service at a high level.

with Respect Your Vladislav Expforex


Related posts


  • Signal bar shift


    Signal bar shift Signal bar Drawing shift indicators, from what they eat indoor bar and the current bar. Parse examples of indicators portray and...


  • This result is visible nice;


    This result is visible nice;) On fibovskom competition is constantly working - experience innovations. This week is no exception - the new check is not...


  • DollarRuble Technical Analysis


    Dollar / Ruble (USDRUB) Technical Analysis - multidirectional correctional movement to the support level of 53.02 On day timeframe price is the primary...


Next posts


  • Screencast Maks Kayzer Kriptoserebro

  • Will dollar as strong in IV quart

  • Screencast Maks Kayzer Who and

EURUSD Euro went to two year low

EUR / USD: Euro went to two-year low, the dollar becomes stronger

Friday, the euro falls
against the dollar, again reaching a two-year
minimum. it is all due to the fact that
the demand for dollars is amplified before
the publication of the US employment report.
These appear today in the late afternoon.


At the close of Asian
session, the EUR / USD reached a level of 1.2643 -
This session low, but later
It consolidated around 1.2646. Now the pair
It is trading at 1.2645, down 0.19%. rather
all, the ratio EUR / USD finds support
at the level of 1.2570 (at least September 30), and
resistance at 1.2716 (maximum
29 September).


Now investors
waiting, and their behavior is most
It depends on how the report will be
Employment in non-agricultural
US sector. According to the forecast, it was in the US
It created more than 200 thousand. jobs
August.


Yesterday, on Thursday,
The European single currency has not received
support when the European Central
Bank refrained from declaring
additional easing, even though
fears of deflation in the euro zone. The president
ECB Mario Dragi said that the fourth
quarter the bank will repurchase securities
secured by assets and the launch
purchase program of mortgage bonds
in the second half of October. Programs
for two years, they must
significantly increase the ECB's balance sheet.
We kept the benchmark interest rate
to record low - 0.05%.


The single currency now!
rising against the pound after the morning
drop to 0.7835. Couple EUR / GBP increased by
0.08%, reached the level of 0.7853.


Related posts


  • EURUSD Euro continues to lose


    EUR / USD: Euro continues to lose ground against the dollar During the Asian trading on Tuesday morning, the euro against the the dollar continued its...


  • EURUSD general analysis


    EUR / USD: general analysis Current trend The single European currency slightly weakened position against the US dollar during the trading session on 23...


  • Euro falls dollar strengthens


    Euro falls , dollar strengthens Yesterday, after the the collapse in oil prices, the euro crossed the a nine-year low, and now the EURUSD It is trading...


Next posts


  • Technical Support our site to

  • Screencast Maks Kayzer Kriptoserebro

  • Will dollar as strong in IV quart

Friday, May 4, 2018

Close Days

Close Days


Close Days - multi-adviser.


Advisor uses to trade high-risk trading strategies like the Martingale.


Thanks to a strategy to close all positions open positions on the basis of the maximum or minimum range of candles, set take-prosieves and stop-loss can be adapted to virtually any trading market conditions. It may work on other major pairs.


Advisor can be run on a demo or live account any broker MetaTrader 4, and an advisor will automatically calculate the schedule for automated trading.


recommendations


  • Use VPS.

  • The minimum initial deposit - only $ 1000.

  • The parameter values ​​in the EA are optimal, but you can change them if necessary.

  • In trading №1 rule is to protect the capital.

  • For some transactions using a fixed take profit.

  • If the transaction price does not reach take-profit group transactions could still be closed in profit.

  • The best money management.

  • Advisor is not very sensitive to spreads and slippage, so that it can work in almost any market conditions and on any accounts.

  • An expert can perform a large number of transactions, so that it can be used for rebeytov system.


Options


  • MAGICMA - the magic number.

  • Lot - the number of lots to trade.

  • Takeprofit - level take profit.

  • Stoploss - stop-loss level.

  • periode - range bars.

  • Slippage - the maximum slippage in transactions to buy and sell.


about the author


My name Sabil Yudifera (Sabil Yudifera), I'm a programmer, web designer, engaged in digital marketing and forex trading.


I have experience in the Forex market for over 5 years. All the time I devote to developing better automatic strategy.


Step by step ordering instructions advisor: https://www.mql5.com/ru/articles/498

How to fund: https://www.mql5.com/ru/articles/302
Close Days

Related posts


  • Universal Partial Close


    Universal Partial Close The eternal question: "How to keep the earned profit?" you can use partial closure (Partial Close - PC). PC do better...


  • Phantom


    Phantom Fully automated multi-adviser. Do not apply the martingale, grid trading . For protection use a stop loss. Powered pending orders permitted to...


  • NewsSpeed


    NewsSpeed News Speed ​​Advisor written for EURUSD M1 trading on news output, changing the settings can be probyvat other currency pairs and time periods...


Next posts


  • CAP Asian Scalper EA

  • Hedging Martingale EA

  • Poseidon Scalper

Thursday, May 3, 2018

Trajecta Smart

Trajecta Smart


Trajecta Smart - an innovative semi-automatic trading signals indicator for each pair and timeframe, which has a built-in system to determine the best and worst signal periods.


Work indicator is to render the best point in time for trading using the trend review panel and provide the trader the possibility of visual testing strategy on any pair and timeframe.


In addition, it is not necessary to configure anything - the indicator setting was made on the basis of the data analysis of the most profitable Trajecta Labs sets the parameters for signal algorithms. The indicator will search the signals to buy / sell and inform you about them using the alerts, customizable by the user.


With trade signals represented indicator merchants can determine the best pairs and timeframes and visually evaluate those or other trading signals.


Strategy


The basis of the indicator strategy is "smart" identification of lines of support and resistance, and the dynamics of price changes. It can be used on any time frame and a pair of selecting the best performance for more than 90%.


Trajecta VTP - Panel trends survey


This is our first indicator that a trend view pane Trajecta VTP - innovative panel that facilitates decision-making by using the trading signals indicator. The panel laid algorithm for determining best and worst signal periods. The information is provided in real-time using the following notation:


  • Grey Colour: probably a weak trend (usually at the beginning of the appearance of the signal)


  • Green color: probably a strong trend (a good time to partially close a position)

  • Blue colour: probably nearing the end of a strong trend

  • Red color: probably a bad sign (be prepared to stop the trade)


Trajecta VIB - Visual Testing indicator


Exerting a lot of effort to create the possibility to visualize the testing of trading signals indicator, we have developed a visual testing technology indicators - Trajecta VIB.


Our innovative system will allow for multiple testing on any pair and time frame with a single click.


To do this, you need to maximize the scale of the graph and visually compare the number of bars of green / blue and red bars. The more bars, the green / blue color, the better.


Quality Control Panel


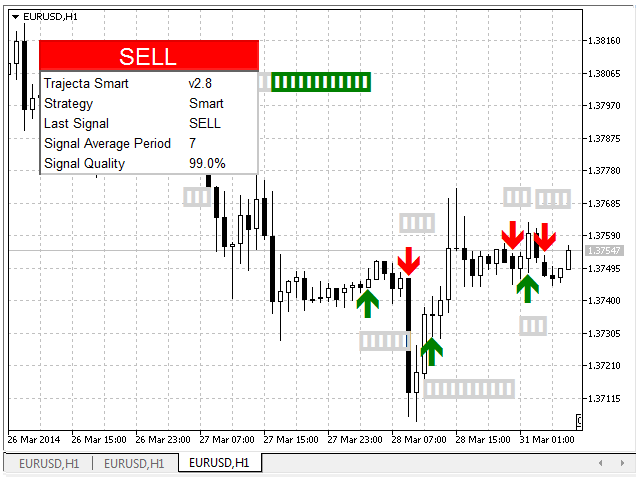
Quality control panel displays information about the last signal and its quality:


  • version indicator

  • Strategy

  • The last signal (BUY or SELL)

  • Average signal period (the average length of all signals)

  • Signal quality (signal quality indicators in real-time)


alerts panel


You can activate alerts panel and receive messages when the signal changes of direction.


Step by step instructions on the use of


  1. Select a symbol for trade

  2. Select the period in which the sale will be conducted

  3. Wait to buy or sell signal (be patient when working on periods over M30).

  4. Align the Stop Loss and Take Profit.

  5. If trades efficiency below 90%, return to step 1 and a pair change period value or Stop Loss / Take Profit.


Trajecta Smart

Related posts


  • Trajecta SpeedMap NZD


    Trajecta SpeedMap NZD What happens when you combine a trade market experience and intuition with the algorithm implemented in the form of visual maps? In...


  • PipTick Pairs Cross MT5


    PipTick Pairs Cross MT5 Indicator PipTick Pairs Cross works with negatively correlated trade instruments such as the EURUSD and USDCHF. indicator is...


  • Herrick Payoff Index


    Herrick Payoff Index payment index Herrick (Herrick Payoff Index, HPI) confirms the strong trends and helps determine when they change its direction;...


Next posts


  • Rubber tape

  • Levels MQL MT5

  • Synthetic

Wednesday, May 2, 2018

Trapezoidal Support and Resist

Trapezoidal Support and Resistance


Support and resistance levels - the point at which the price trend may stop and turn around - is widely used for short-term price forecasting.


This indicator can be used as a signal to buy and sell when the current price rises above or falls below the levels of resistance / support, respectively, as well as the StopLoss for open positions.


Trapezoidal Support and Resist

Related posts


  • Better Support Resistance


    Better Support Resistance Better Support Resistance shows the optimal support line and / resistance zone. It is based on fractals (Fractals) you selected...


  • FiBoPivot


    FiBoPivot This indicator support / resistance levels, rather than buy / sell. If there is reliable evidence of price action (for example, derived...


  • PipSeek for MT4


    PipSeek for MT4 Analog indicator PeepSeek. Dynamic trohperiodnye exponential levels act as support or resistance , as indicated by the short-term price...


Next posts


  • Advanced Trend Scanner

  • Tick ​​Volume Histogram Indicator

  • Virtual Level of Market Prices

Batman

Batman Batman Advisor is based on a very simple system that uses ZigZag indicator and breakdown strategy. Transactions are opened only whe...